Metrics and Targets
Aggregated Stewardship Statistics for External Fund Managers
Overall level of voting and engagement activity
Environmental issues, particularly climate change, continue to be one of the priorities in our EFMs’ stewardship efforts. Their voting and engagement efforts across portfolio companies are aimed at reducing greenhouse gas emissions and promoting sustainable practices.
- Total number of resolutions voted on by our EFMs increased by 26%, while the total number of engagements increased by 79%, between calendar year 2020 and 2023.
- Over the past 4 years, there has been a notable increase in environment-related resolutions and engagements, as evidenced in Chart 1 and Chart 2.
Chart 1: Environment-related resolutions voted on by our EFMs increased by 3% in 2023. This represents a total growth of 87% over the last 4 years
.jpg?h=509px&w=809px&hash=09213B2361E300E8C81EC054B9DB4FA3)
Chart 2: Environment-related engagements with portfolio companies undertaken by our EFMs increased by 21% in 2023, and a total growth of 467% over the last 4 years
.jpg?h=509px&w=809px&hash=3E19230E4A82F693A751E2A153DDA337)
Breakdown of Voting Statistics
Our EFMs’ votes on environmental resolutions serve as a crucial mechanism for aligning corporate decisions with sustainable practices. Through these votes, our EFMs advocate for the adoption of eco-friendly policies, implement greener initiatives, and encourage transparency in environmental reporting (and conversely, indicate dissatisfaction with policies that do not adequately prepare the company for a low carbon future).
- North America and Europe made up the majority of total resolutions voted on by our EFMs at 29% and 28% respectively in 2023, as highlighted in Chart 3.
- On environment-related resolutions (Chart 4), a key observation is that North America generates a significantly higher number of such resolutions compared to Asia Pacific. While there is growing awareness and activism around environmental issues in the Asia Pacific, the practice of putting up environmental resolutions for voting is still developing.
- By sector, the largest proportion of votes in 2023 were in the Industrials and Financials sectors, at 19% and 16% respectively, as shown in Chart 5. This reflects the greater materiality of climate change to these sectors and maturity of strategy among the companies.
Chart 3: Our EFMs actively voted on resolutions across most geographies in 2023
.jpg?h=509px&w=809px&hash=334A651C63CF7F4A635A9F4F114E2357)
Chart 4: Majority of the environmental resolutions that our EFMs voted on, were proposed by companies in North America
.jpg?h=509px&w=809px&hash=FD6D8DA85CB7799A72082D3EA4055B4E)
Chart 5: The sectors that our EFMs voted on the most were Industrials, Financials, Consumer Discretionary, Materials, IT and Healthcare
.jpg?h=509px&w=809px&hash=03C5A422C66AB824F57E766E94F2E616)
Breakdown of Engagement Statistics
Engaging with companies has proven to be the most active stewardship tool in driving environmental action. Our EFMs engage with portfolio companies on a multitude of topics, such as managing climate risks and encouraging the adoption of sustainable practices, which directly contributes to mitigating the environmental impact of their business operations. In 2023, our EFMs engaged companies across a total of over 11,000 topics.
- In 2023, the proportion of environment-related engagements increased by 21% yoy, underscoring its growing importance. Furthermore, by prioritising climate considerations through engagements, our EFMs can drive innovation in green technologies and promote transition to a low-carbon economy.
- In 2023, 99% of our EFMs’ engaged with their portfolio companies directly, while the remainder were executed through collaborative efforts with other investors. The high level of direct engagement reflects the commitment from our EFMs which have built significant capabilities to engage companies meaningfully on material ESG issues.
- North America and Europe made up the majority of total engagements by our EFMs, at 55% and 23% respectively in 2023 as highlighted in Chart 6.
Chart 6: Our EFMs undertook engagements across most geographies in 2023 (%)
.jpg?h=509px&w=809px&hash=BC95F3939C7AF95550604455254CA23F)
Chart 7: On environmental-related engagements, while engagements with companies in North America and Europe remains the majority at 41% and 23% respectively, portfolio companies in APAC have also been more open to engagements on environmental topics
.jpg?h=509px&w=809px&hash=E1831F054F6406299CAD047F14214B05)
Chart 8: Our EFMs most frequently engage companies in the Financials, Consumer Discretionary and Industrials sectors
.jpg?h=509px&w=809px&hash=EF99F7341865BC2DB250A5DC9407242D)
Our EFMs’ stewardship efforts encourage companies to focus on long-term sustainability and help to drive meaningful progress in reducing carbon emissions and mitigating the negative impact of climate change. Engagement can lead to improvements in transparency and greater clarity on transition plans. Our EFMs also vote on governance-related resolutions, which include encouraging companies to improve their governance standards, especially the level of transparency and accountability in climate risk management. These collective efforts are essential in addressing global environmental challenges and achieving climate objectives.
Stewardship Case Studies
Stewardship requires conviction, commitment, and time. Starting from the Sustainability Report 2021/2022, we have highlighted some examples of how our EFMs have been engaging portfolio companies – encouraging them to establish clearer transition plans, make progress towards climate commitments, and improve climate disclosures. The overall voting and engagement statistics provide a sense of the scale and intensity of stewardship activities. The case studies below provide examples of how these efforts have made a difference in our portfolio companies.
Case Study 1 - Engagement on Decarbonisation
One of MAS' EFMs invests in a leading manufacturer of agricultural and forestry equipment based in the US. The company focuses on a range of innovative solutions involving automated precision and smart equipment that improve resource efficiency for its customers.
The EFM engaged with the company to detail how its products create financial and environmental value. Through its engagements, the EFM encouraged the company to set out clear decarbonisation targets, and link its sustainability goals with its overall business strategy. The EFM also encouraged the company to improve communications with stakeholders such as rating agencies and other investors, to raise their awareness of the clean tech capabilities of the company.
In 2024, the company published a new integrated financial and sustainability report which clearly lays out their commitments to meet their decarbonisation targets. The company is now implementing decarbonisation plans to meet those targets and further seeks to create more positive impact by reducing emissions throughout its value chain. In particular, it has also set quantifiable targets to increase the usage of low-carbon and recyclable inputs in its manufacturing process.
Case Study 2 - Engagement on Energy Transition
One of MAS’ EFMs invests in a major cement producer in Indonesia. Cement production is carbon-intensive as the cement would be heated to high temperatures mainly using coal. In addition, the use of limestone also produces carbon dioxide as a byproduct.
The EFM engaged with the company over several years on the carbon intensity of its activities, and the need to shift its energy mix away from coal and to reduce its carbon dioxide emissions.
The company’s alternative-fuel use has continued to climb, with its targeted share of the use of alternative fuels for 2030 increasing from 30% to 42%. The company has also confirmed that the reduction of carbon dioxide emissions and the average dust emissions has continued to improve. Dust emissions, gross scope 1 carbon dioxide emissions, and Net Scope 1 carbon dioxide emissions have all improved over recent years.
Case Study 3 - Engagement on Carbon Disclosure
One of MAS’ EFMs invests in a major oil and gas producer.
The EFM engaged with the company to improve disclosures and set targets with respect to its carbon footprint.
The company has since then disclosed several key targets. These include the reduction of total operational absolute emissions by 30% before 2030, and the reinjection of emissions into carbon capture and utilisation (CCU) projects. The company has also established business segment-specific GHG reduction targets before 2025 and 2030.
Scope 1 and 2 WACI of the Equities and Corporate Bonds Portfolios
Measuring the Emissions Profile of MAS' Equities and Corporate Bonds Portfolio
To gauge the level of transition risks and monitor the effectiveness of our actions, we measure and report the Weighted Average Carbon Intensity (WACI) of our equities and corporate bonds portfolios.
The WACI figures presented in this report only considered Scope 1 and Scope 2 emissions of the companies in the portfolio, weighted by the size of the investment in the company in relation to the size of the equities or corporate bonds portfolios.
- Scope 1 and 2 emissions represent the direct emissions of greenhouse gas controlled and produced by the company and the indirect emissions of greenhouse gas from the consumption of purchased electricity, heat, or steam by the company respectively.
- We do not include Scope 3 emissions, which refer to all other indirect emissions occurring in the value chain of the company as (i) the level of reporting of Scope 3 emissions by companies remains low today, therefore requiring a larger degree of estimation; and (ii) the inclusion of Scope 3 emissions would result in double counting when emissions statistics are aggregated at the portfolio level.
We are developing capabilities to measure and analyse portfolio climate risks using other relevant emissions-based and forward-looking metrics and will consider including these metrics in future reports.
Measuring MAS' Equities Portfolio WACI against Market Benchmarks
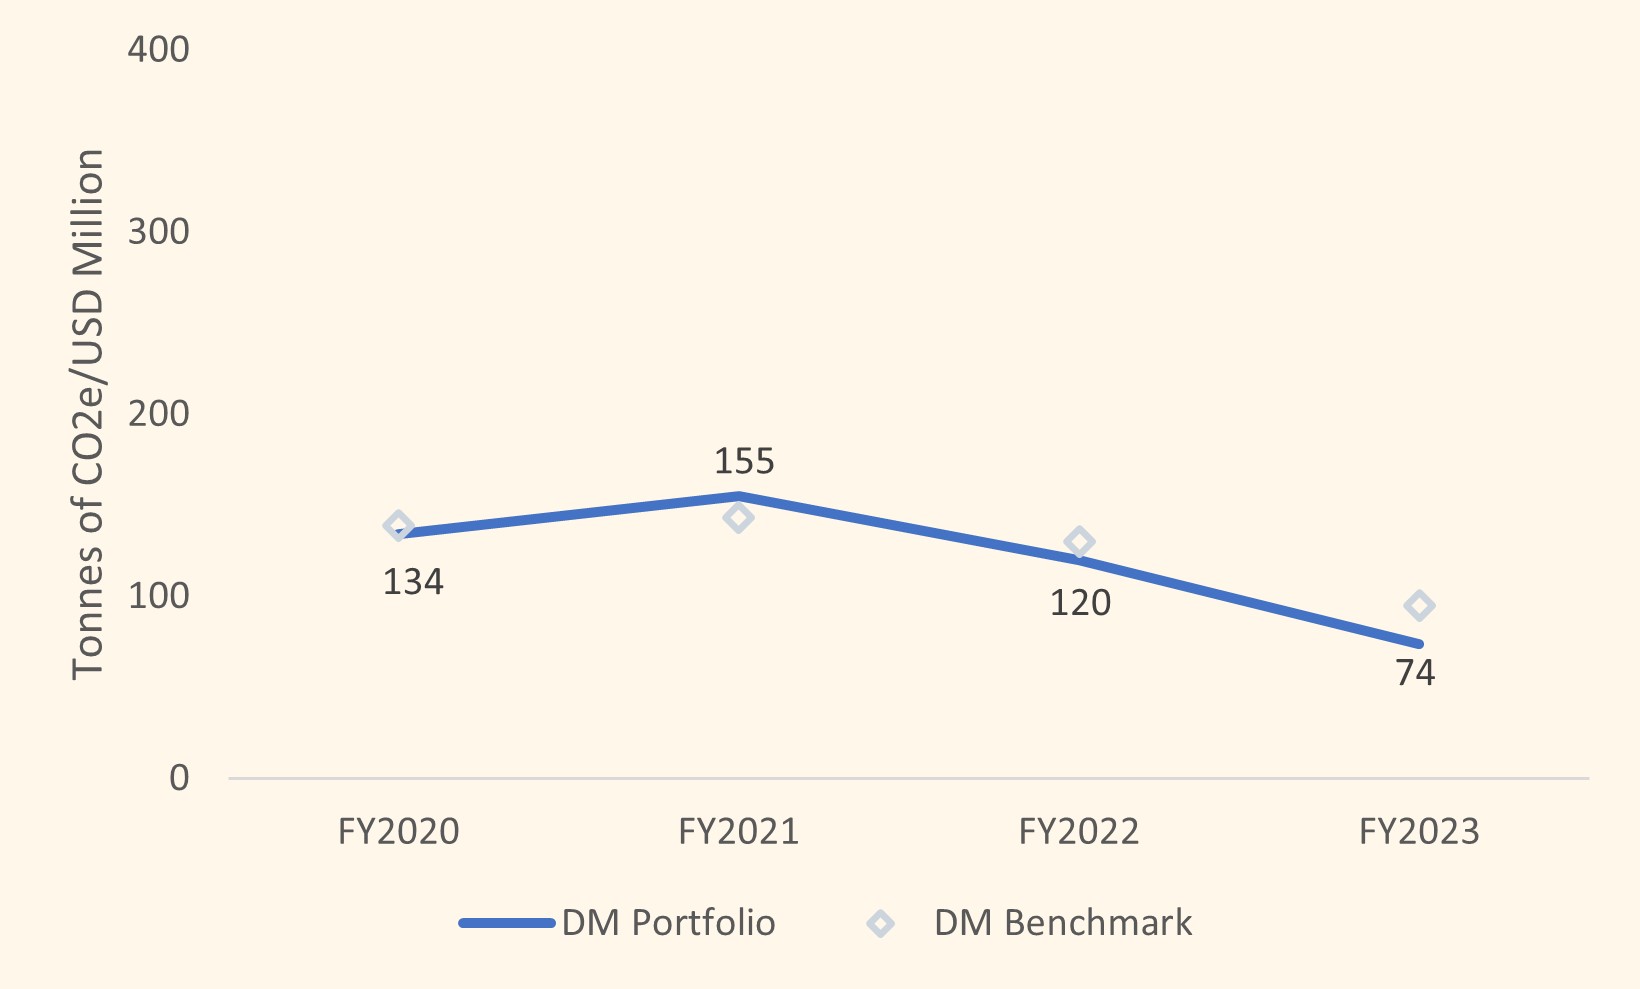
The WACI for MAS’ Developed Markets (DM) equities portfolio decreased from FY2022 to FY2023, alongside with a decrease in the WACI for the DM equities benchmark, which remained higher than the MAS’ DM equities portfolio.
The WACI for MAS’ DM equities portfolio and the benchmark continued to trend lower (see Chart 8). This is mainly attributed to a lower average carbon intensity of companies, especially for the most carbon intensive sectors (e.g. Energy, Materials and Utilities). As the benchmark only represents a sub-set of publicly listed companies in the developed markets, the trend observed from the change in WACI levels over time is an imperfect proxy of the overall decarbonization trajectory of the broader economy. Nonetheless, the downward trend in carbon intensity of the benchmark and the average company across various sectors, especially if sustained, provides a useful reference point on the progress of an orderly low carbon transition in the developed markets.
As of FY2023, the benchmark WACI remained higher than MAS’ DM equities portfolio WACI. Active investment allocation decisions of our external managers coupled with the effect of targeted portfolio actions such as the Climate Transition Programme (CTP) and the exclusion of thermal coal mining and oil sand companies helped to tilt the portfolio towards less carbon-intensive companies relative to the benchmark.
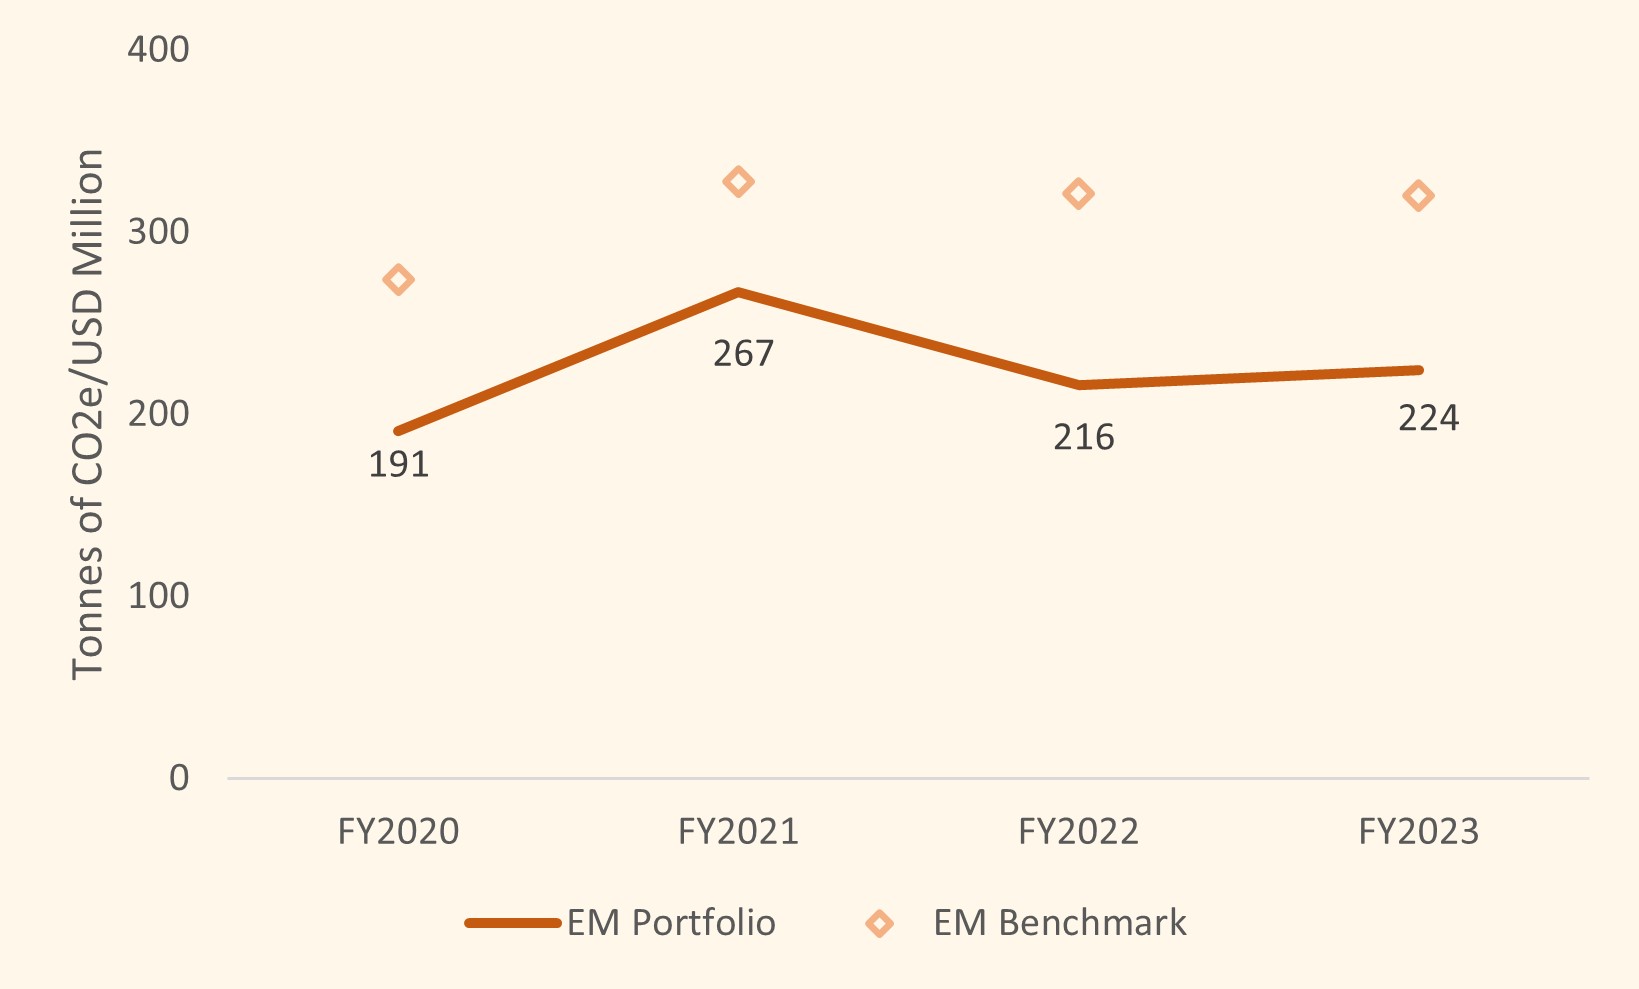
The WACI for MAS’ Emerging Markets (EM) equities portfolio increased slightly from FY2022 to FY2023, but remained significantly lower than the WACI for the EM equities benchmark, which remained almost flat over the period.
The increase in WACI for MAS’ EM equities portfolio was attributed to active investment decisions of external managers which increased weights to selected companies with higher carbon intensity in the Utilities sector.
Nonetheless, WACI of the portfolio remained lower than the benchmark as the portfolio continued to remain underweight to the Energy, Materials, and Utilities sectors overall compared to the benchmark. Targeted portfolio actions such as the Climate Transition Programme (CTP) and the exclusion of thermal coal mining and oil sands companies also helped to tilt the portfolio towards less carbon-intensive companies relative to the benchmark.
The benchmark itself did not see a significant reduction in WACI. There was a decline in the overall average carbon intensity of EM companies, but this was less pronounced than that seen for DM companies, reflecting slower decarbonisation progress in emerging markets. This reduction, however, was offset by an increase in the weights of the benchmark constituents of more carbon intensive companies, reflecting their increase in market capitalisation over the year.
Chart 9: Equities Portfolio WACI(in tonnes CO2e/ USD million of revenues)
Measuring MAS' Corporate Bonds Portfolio against Market Benchmark
Corporate bonds are relatively less impacted by transition risks than equities, since bonds generally have shorter, fixed tenures, and investors in corporate bonds bear less risk as creditors sit higher up the capital structure relative to equity shareholders, and suffer losses only after equity shareholders.
The WACI for MAS’ corporate bonds portfolio decreased in conjunction with the corporate bond benchmark from FY2022 to FY2023, with the WACI for MAS’ corporate bonds portfolio decreasing at a faster pace.
Relative to the benchmark, MAS’ corporate bonds portfolio saw a larger reduction in WACI due to active investment allocation by our external managers for corporate bonds which resulted in a reduction in exposure to corporate bonds by Utilities issuers (which was the reason for the higher portfolio WACI in FY2022 compared to FY2021). As the portfolio is actively managed by our external managers, the WACI of the portfolio relative to benchmark is expected to fluctuate subject to active investment allocation across corporate bonds issuance by the managers.
The WACI for MAS’ corporate bonds portfolio continues to be lower than its benchmark from FY 2022 to FY 2023. The lower WACI was due to MAS’ portfolio construction framework which screens out debt securities with smaller issuance sizes, which are also in more carbon intensive sectors. As a result, the portfolio has a lower exposure to debt securities issued by companies in carbon intensive sectors relative to the market benchmark.
Chart 10: Corporate Bonds Portfolio WACI(in tonnes CO2e/USD million of revenues)
.jpg?h=450px&w=809px&hash=2A4280313F8AAEB706BBCA37902D4D5A)