Metrics and Targets
Aggregated stewardship statistics for EFMs
Overall level of voting and engagement activity
Environmental issues, particularly climate change, continue to be a priority in our EFMs’ stewardship efforts. Their voting and engagement efforts across portfolio companies are aimed at reducing greenhouse gas emissions and promoting sustainable practices.
- The total number of resolutions voted on by our EFMs increased by 24%, while the total number of engagements increased by 67%, over the last 5 years.
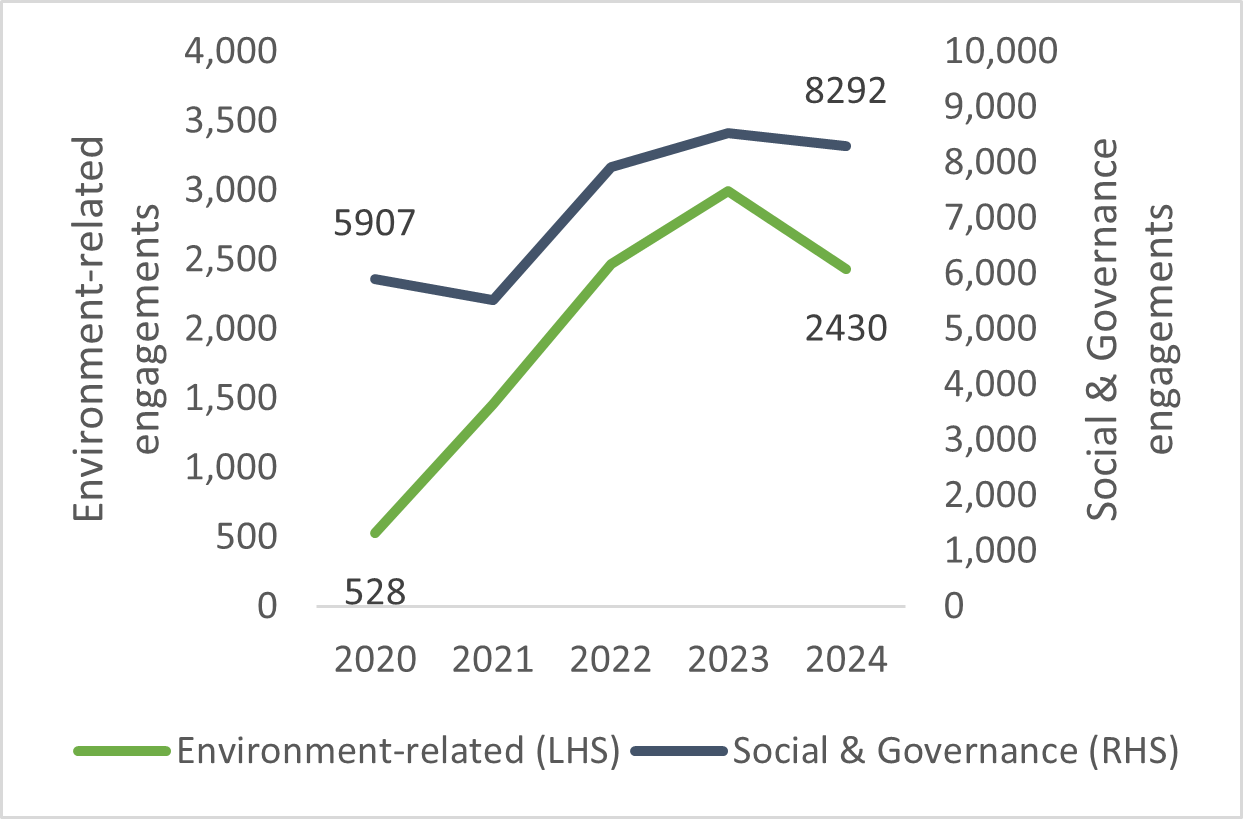
- Over the past 5 years, there has been a notable increase in environmental-related resolutions and engagements, as evidenced in Charts 1 and 2.
Chart 1: Environment-related resolutions voted on by our EFMs increased by 26% in 2024. This represents a total growth of 135% over the last 5 years.
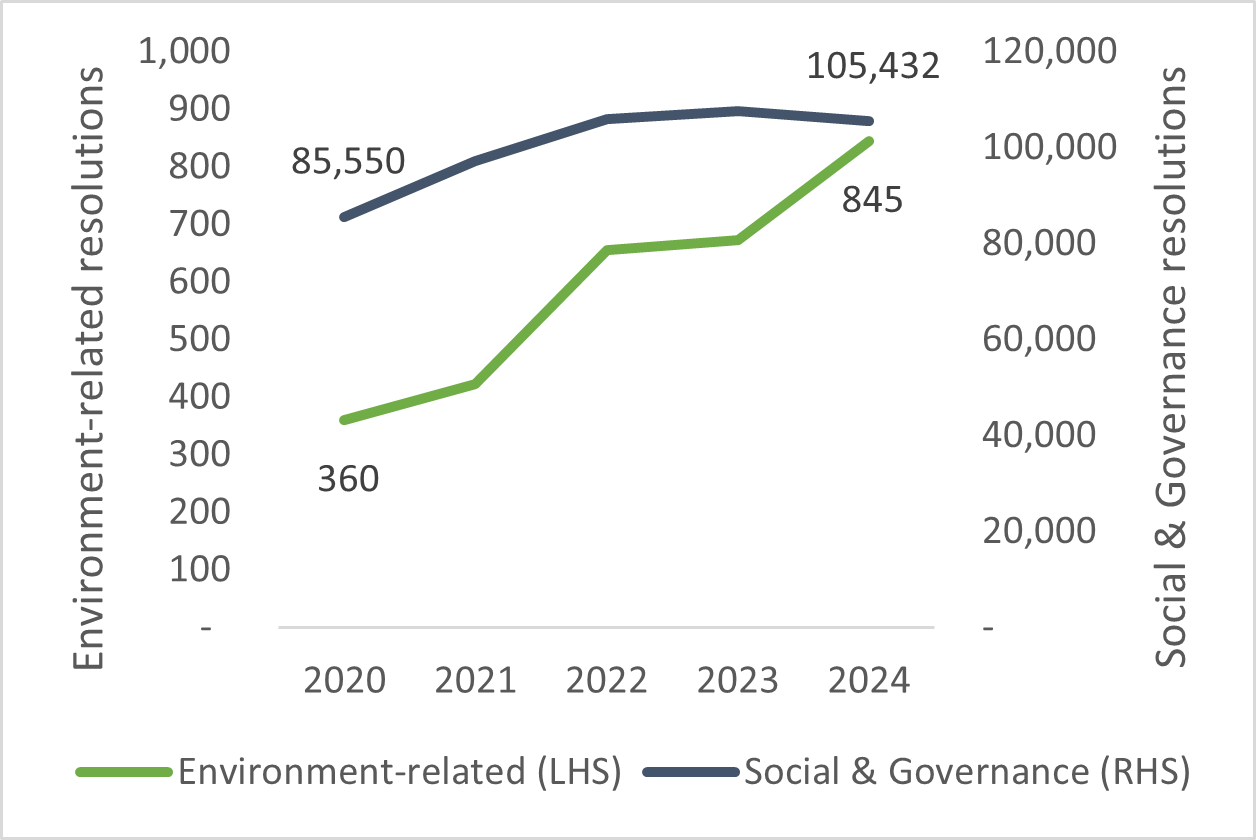
Chart 2: Environment-related engagements with portfolio companies undertaken by our EFMs increased by 360% in 2023 over the last 5 years.
Breakdown of Voting Statistics
Our EFMs’ votes on environmental resolutions serve as a crucial mechanism for aligning corporate decisions with sustainable practices.
- North America and Europe made up the majority of total resolutions voted on by our EFMs at 32% and 33% respectively in 2024, as highlighted in Chart 3.
- On environment-related resolutions Chart 4, North America generated a significantly higher number of such resolutions compared to Asia Pacific. While there is growing awareness and activism around environmental issues in the Asia Pacific, the practice of putting up environmental resolutions for voting is still developing.
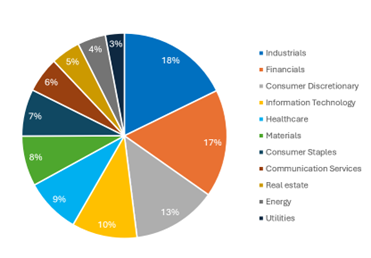
- By sector, the largest proportion of votes in 2024 were in Industrials and Financials at 18% and 17% respectively, as shown in Chart 5. This reflects the greater materiality of climate change to these sectors, and the maturity of climate strategy among companies in these sectors.
Chart 3: Our EFMs actively voted on resolutions across most geographies in 2024.
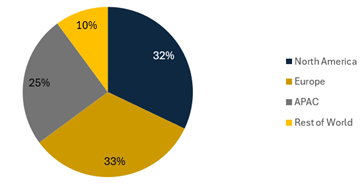
Chart 4: Majority of the environmental resolutions that our EFMs voted on, were proposed by companies in North America.
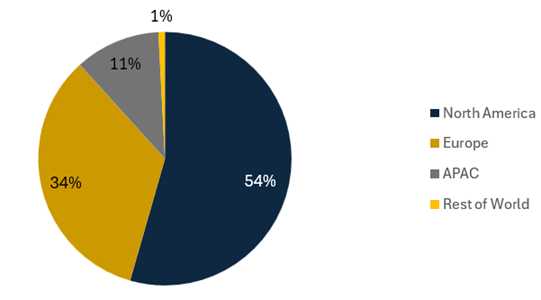
Chart 5: The sectors that our EFMs voted on the most were Industrials, Financials, Consumer Discretionary, and IT.
Breakdown of Engagement Statistics
Engaging with companies has proven to be the most active stewardship tool in driving environmental action.
- In 2024, 97% of our EFMs’ engaged with their portfolio companies directly. The high level of direct engagement reflects the commitment from our EFMs who have built significant capabilities to engage companies meaningfully on material ESG issues.
- Majority of our EFMs’ engagements continue to be with companies in North America and Europe. Specifically, environmental-related engagements with companies in North America and Europe have increased to 68% in 2024 from 64% in 2023.
Chart 6: Our EFMs undertook engagements across most geographies in 2024.
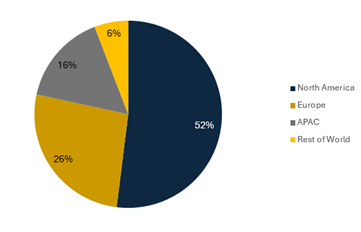
Chart 7: While North America and Europe still account for the majority of our environmental-related engagements at 39% and 29% respectively, portfolio companies in APAC have become more open to such engagements.
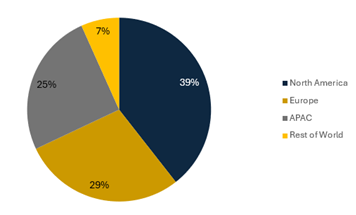
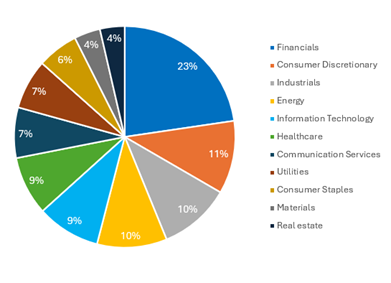
Chart 8: Our EFMs most frequently engage companies in the Financials, Consumer Discretionary, Industrials and Energy sectors.
Our EFMs’ stewardship efforts encourage companies to prioritise long-term sustainability over short-term profit and help to drive progress in reducing carbon emissions and in mitigating the negative impact of climate change. Engagement can lead to improvement in transparency and greater clarity on transition plans. Our EFMs also vote on governance-related resolutions, which include encouraging companies to improve their governance standards, especially the level of transparency and accountability in climate risk management. These collective efforts are essential in addressing global environmental challenges and achieving climate objectives.
Stewardship case studies
Since the 2021/2022 Sustainability Report, we have highlighted examples of how our EFMs have been engaging portfolio companies on how they manage climate risks. These include encouraging them to establish clearer transition plans, make progress towards climate commitments, and improve climate disclosures. The overall voting and engagement statistics provide a sense of the scale and intensity of stewardship activities. The case studies below provide examples of how these efforts made a difference in our portfolio companies.
Case Study 1 - Engagement on Decarbonisation
One of MAS' EFMs invests in a utilities company that specialises in power generation across Asia.
The EFM has consistently engaged with the company, encouraging it to more accurately assess and publicly communicate its progress on phasing out coal and transitioning to renewable/low-carbon energy sources.
Following a comprehensive review of its decarbonisation strategy in 2024, the company has set a more ambitious 2030 decarbonisation target, and committed to reduce GHG emissions per kWh of power sold by 59% by 2030 against a 2019 baseline.
Case Study 2 - Engagement on Decarbonisation
One of MAS’ EFMs invests in a European integrated energy company.
Through bilateral and collaborative channels, the EFM engaged with the company on the need for a clearer decarbonisation strategy. As part of this strategy, the EFM suggested that the company include an assessment of the impact of fossil fuel investment on its environmental footprint, and how such an impact will fit into the company’s longer-term decarbonisation targets.
The company’s latest sustainability reports have become more transparent and comprehensive. These include (i) a more granular breakdown of the company’s estimated energy production mix up to 2030, (ii) the company’s investments and projects in decarbonisation, and (iii) a more detailed explanation of how the company plans to achieve its decarbonisation targets.
Through bilateral and collaborative channels, the EFM engaged with the company on the need for a clearer decarbonisation strategy. As part of this strategy, the EFM suggested that the company include an assessment of the impact of fossil fuel investment on its environmental footprint, and how such an impact will fit into the company’s longer-term decarbonisation targets.
The company’s latest sustainability reports have become more transparent and comprehensive. These include (i) a more granular breakdown of the company’s estimated energy production mix up to 2030, (ii) the company’s investments and projects in decarbonisation, and (iii) a more detailed explanation of how the company plans to achieve its decarbonisation targets.
Case Study 3 - Engagement on emission and energy consumption targets
One of MAS’ EFMs invests in an Asian e-commerce and delivery platform.
The EFM engaged with the company on its energy consumption and greenhouse gas emission targets.
Thereafter, the company provided a more granular breakdown of its Scope 1 and 2 emissions at various levels of its operations. Additionally, the company is currently working with external parties on the tracking of its Scope 3 emissions.
The company is also currently on track to design and disclose objectives aligned with the Science-Based Targets initiative (SBTi). Finally, the company has introduced a project focused on the circular economy, which includes measures like introducing biodegradable packaging and working with local governments in the setting up of recycling collection points.
Scope 1 and 2 WACI of the Equities and Corporate Bonds Portfolios
Measuring the Emissions Profile of MAS' Equities and Corporate Bonds Portfolio
To gauge the level of transition risks and monitor the effectiveness of our actions, we measure and continue to report the Weighted Average Carbon Intensity (WACI) of the equities and corporate bonds portfolios.
The WACI figures presented in this report reflect the Scope 1 and Scope 2 emissions of companies in the portfolio, weighted by the size of the investment in the company in relation to the size of the equities or corporate bonds portfolios.
- Scope 1 and 2 emissions represent the direct emissions of greenhouse gas controlled and produced by the company and the indirect emissions of greenhouse gas from the consumption of purchased electricity, heat or steam by the company respectively.
- We do not include Scope 3 emissions, which refer to all other indirect emissions occurring in the value chain of the company as (i) the level of Scope 3 emissions reporting by companies remains low today, therefore requiring a larger degree of estimation; and (ii) the inclusion of Scope 3 emissions would result in double counting when emissions statistics are aggregated across a large portfolio.
We are developing capabilities to measure and analyse portfolio climate risks using other relevant emissions-based and forward-looking metrics and will consider including these metrics in future reports.
Measuring MAS' Equities Portfolio WACI against Market Benchmarks
MAS’ Developed Markets (DM) equities portfolio WACI decreased from FY 2023 to FY 2024, despite a slight increase in the DM equities benchmark WACI over the period. As of FY 2024, MAS’ DM equities portfolio WACI continued to remain lower than the DM equities benchmark WACI.
- MAS’ DM equities portfolio WACI continued to decrease from FY 2023 to FY 2024 despite the DM equities benchmark WACI increasing slightly over the period (see chart 9). This is due mainly to a reduction in exposures by our external fund managers to selected carbon-intensive companies within the Materials and Industrials sectors.
- As of FY2024, MAS’ DM equities portfolio WACI continued to remain lower than the DM equities benchmark WACI, with a widening gap. Active investment allocation decisions of our external managers, coupled with the effect of targeted portfolio actions such as MAS’ Climate Transition Programme (CTP) and the exclusion of thermal coal mining and oil sand companies, helped to tilt the portfolio towards less carbon-intensive companies relative to the benchmark.
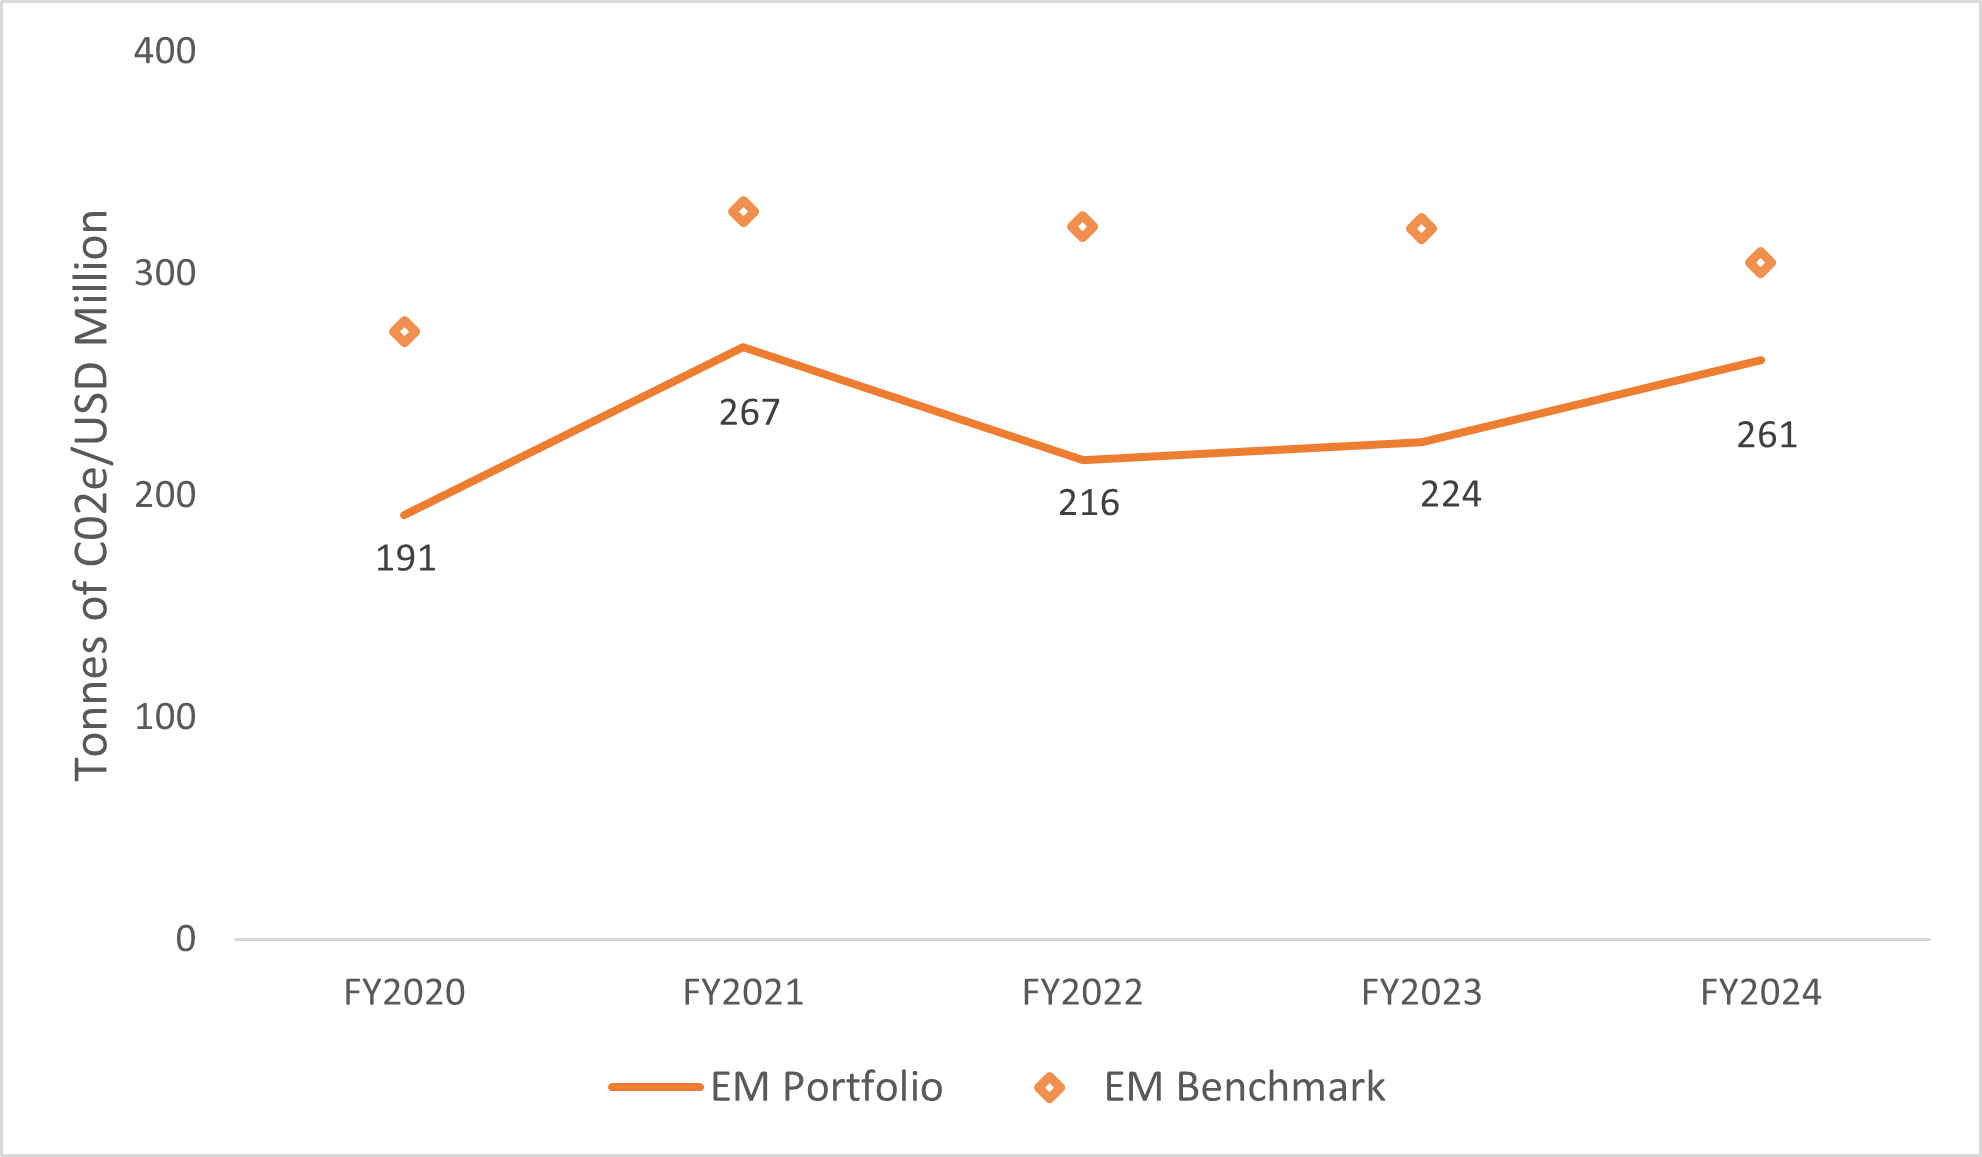
In contrast, MAS’ Emerging Markets (EM) equities portfolio WACI increased from FY 2023 to FY 2024, despite a decrease in EM equities benchmark WACI over the period. Nonetheless, as of FY 2024, MAS’ EM equities portfolio WACI still remained lower than the EM equities benchmark WACI.
- MAS’ EM equities portfolio WACI increased from FY 2023 to FY 2024 due primarily to active investment decisions by our external fund managers, which increased exposure to the carbon-intensive Utilities sector. In contrast, the EM equities benchmark WACI decreased over the period due to a reduction in exposure to Utilities.
- Nonetheless, MAS’ EM equities portfolio WACI remained lower than the benchmark WACI as the portfolio continued to remain underweight to the carbon intensive Energy, Materials, and Utilities sectors relative to the benchmark. Targeted portfolio actions, such as the Climate Transition Programme (CTP) and the exclusion of thermal coal mining and oil sands companies, also helped to tilt the portfolio towards less carbon-intensive companies relative to the benchmark.
Chart 9: DM Equities Portfolio WACI (in tonnes CO2e/ USD million of revenues)
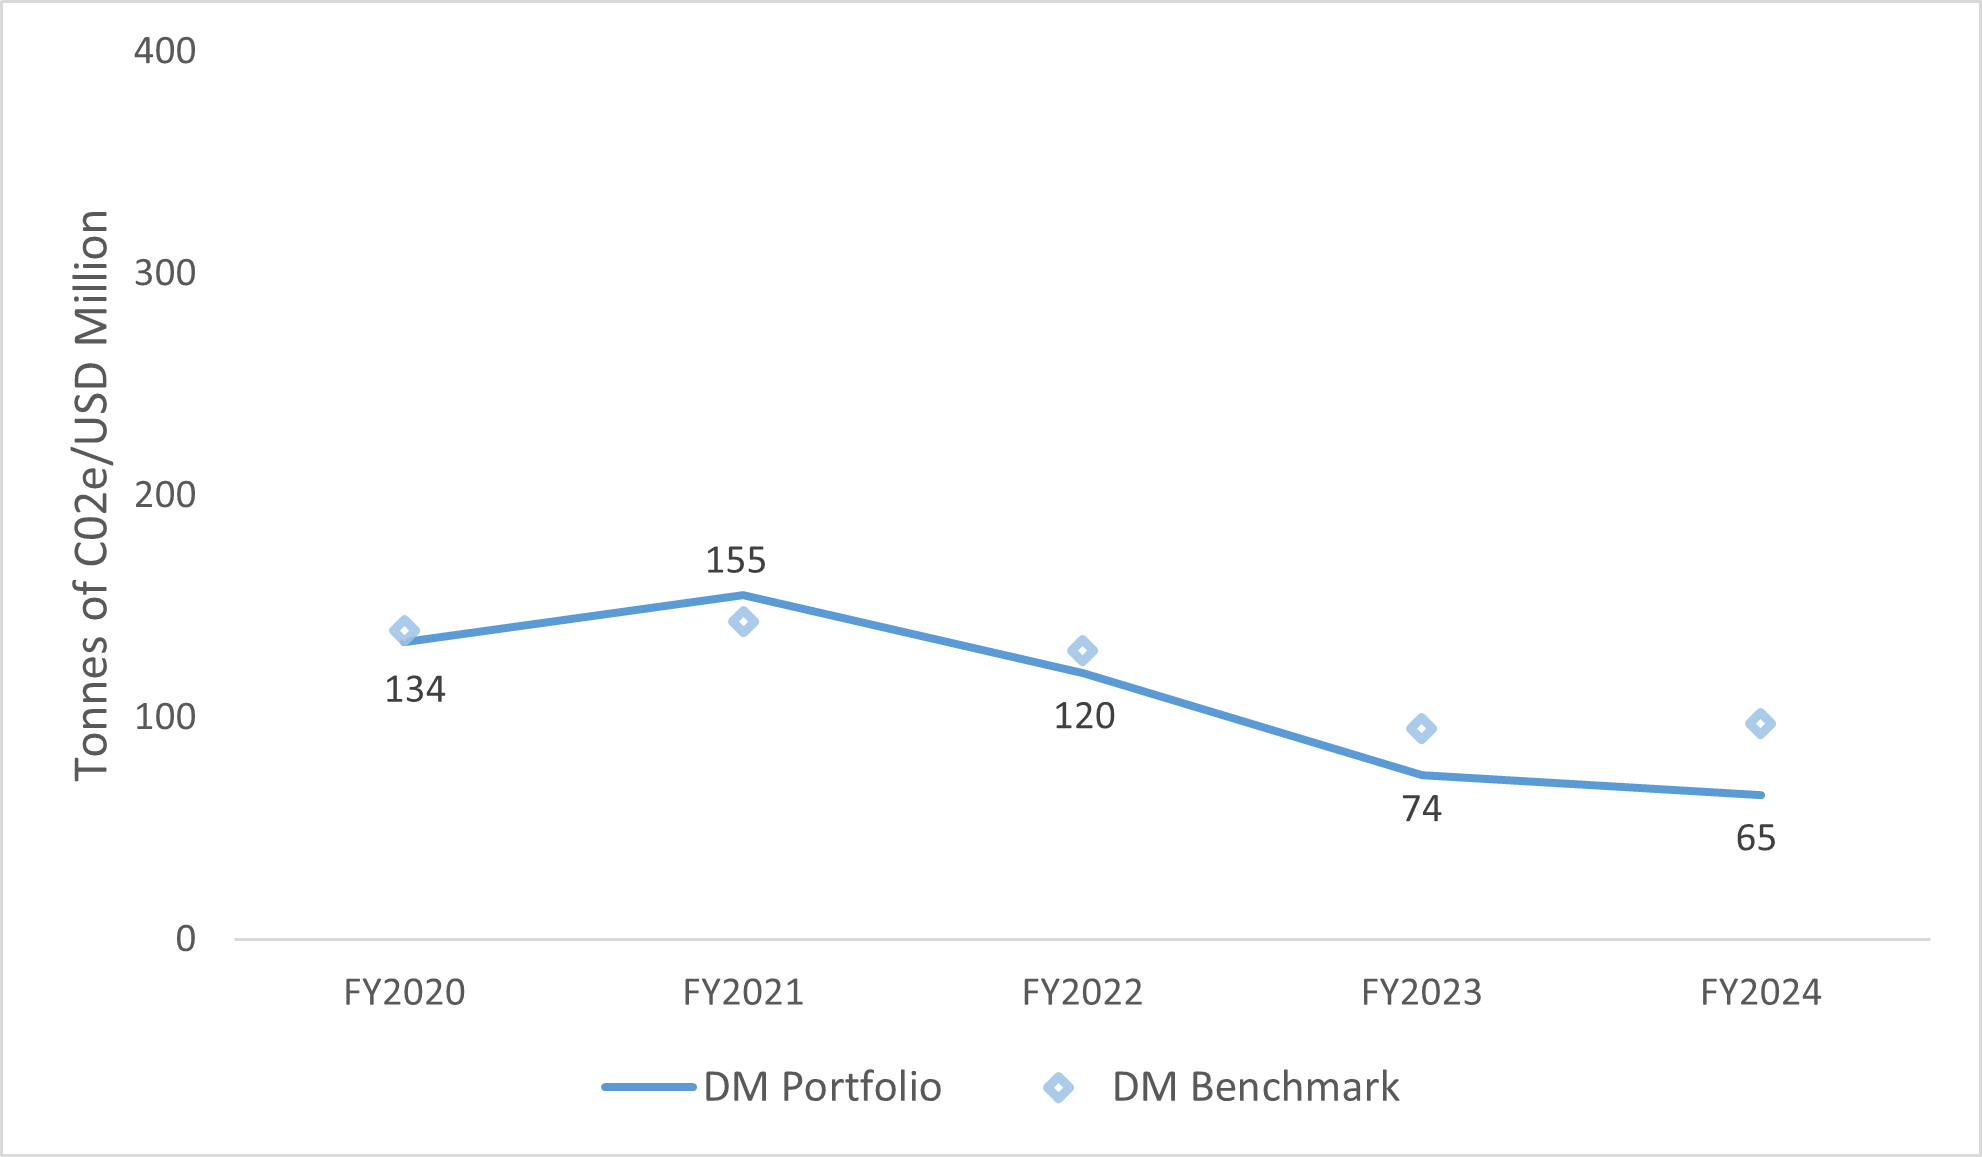
Chart 10: EM Equities Portfolio WACI (in tonnes CO2e/ USD million of revenues)
Source: MAS calculations. Certain information ©2025 MSCI ESG Research LLC. Reproduced by permission.
Measuring MAS' Corporate Bonds Portfolio against Market Benchmark
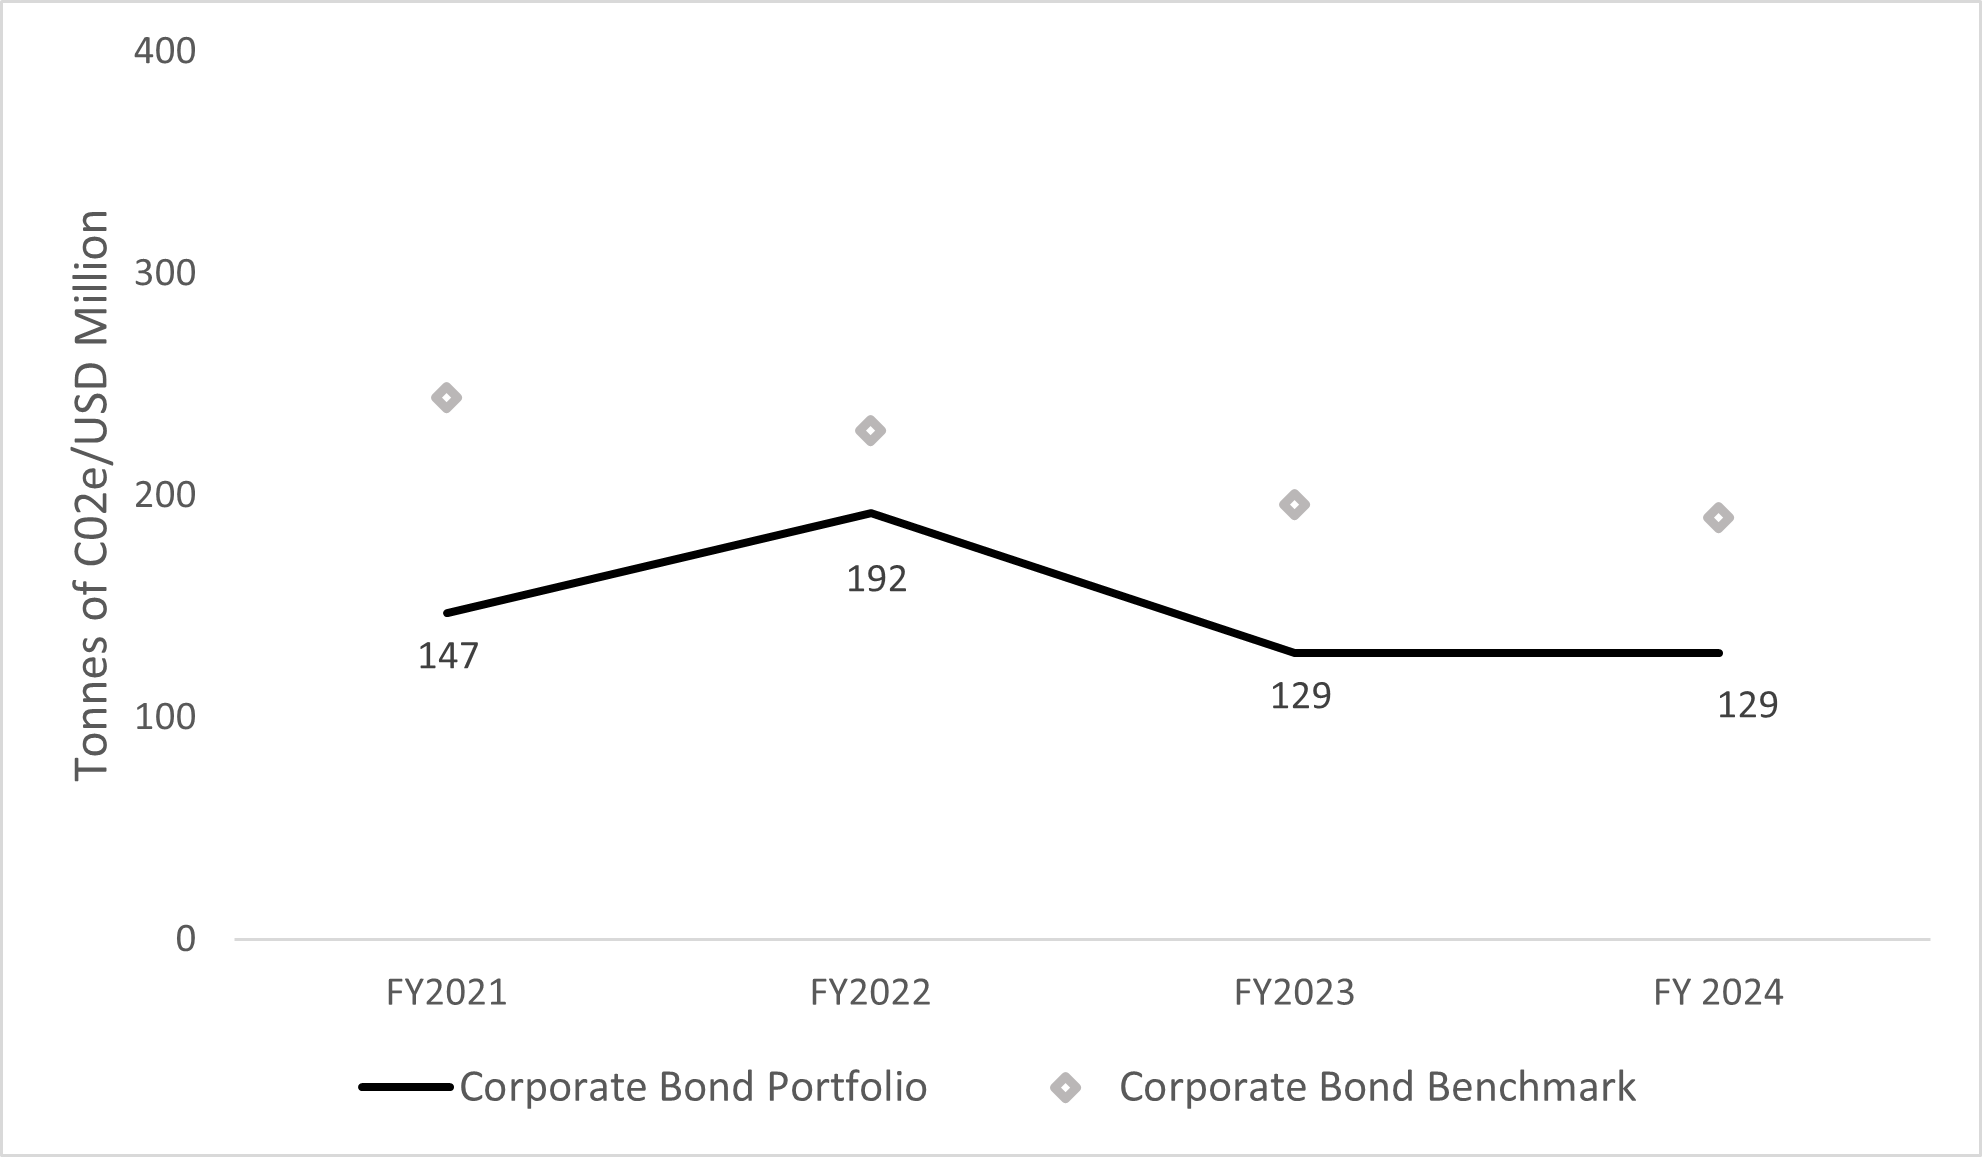
MAS’ Corporate Bond portfolio WACI and its benchmark WACI did not see any significant changes from FY2023 to FY2024. As of FY 2024, MAS’ corporate bonds portfolio WACI remained lower than the corporate bonds benchmark WACI.
MAS’ corporate bonds portfolio WACI remained lower than the benchmark WACI due mainly to MAS’ portfolio construction framework, which screens out debt securities with smaller issuance sizes that tend to be in more carbon intensive sectors.
Chart 11: Corporate Bonds Portfolio WACI(in tonnes CO2e/USD million of revenues)(in tonnes CO2e/USD million of revenues)
* Certain information contained herein (the “Information”) is sourced from/copyright of MSCI Inc., MSCI ESG Research LLC, or their affiliates (“MSCI”), or information providers (together the “MSCI Parties”) and may have been used to calculate scores, signals, or other indicators. The Information is for internal use only and may not be reproduced or disseminated in whole or part without prior written permission. The Information may not be used for, nor does it constitute, an offer to buy or sell, or a promotion or recommendation of, any security, financial instrument or product, trading strategy, or index, nor should it be taken as an indication or guarantee of any future performance. Some funds may be based on or linked to MSCI indexes, and MSCI may be compensated based on the fund’s assets under management or other measures. MSCI has established an information barrier between index research and certain Information. None of the Information in and of itself can be used to determine which securities to buy or sell or when to buy or sell them. The Information is provided “as is” and the user assumes the entire risk of any use it may make or permit to be made of the Information. No MSCI Party warrants or guarantees the originality, accuracy and/or completeness of the Information and each expressly disclaims all express or implied warranties. No MSCI Party shall have any liability for any errors or omissions in connection with any Information herein, or any liability for any direct, indirect, special, punitive, consequential or any other damages (including lost profits) even if notified of the possibility of such damages.