Metrics and Targets
Voting and Engagement
Overall
Environmental issues, particularly climate change, continue to be a priority in our external fund managers’ (“EFMs”) stewardship efforts. Their voting and engagement efforts across portfolio companies are aimed at reducing greenhouse gas emissions and promoting sustainable practices.
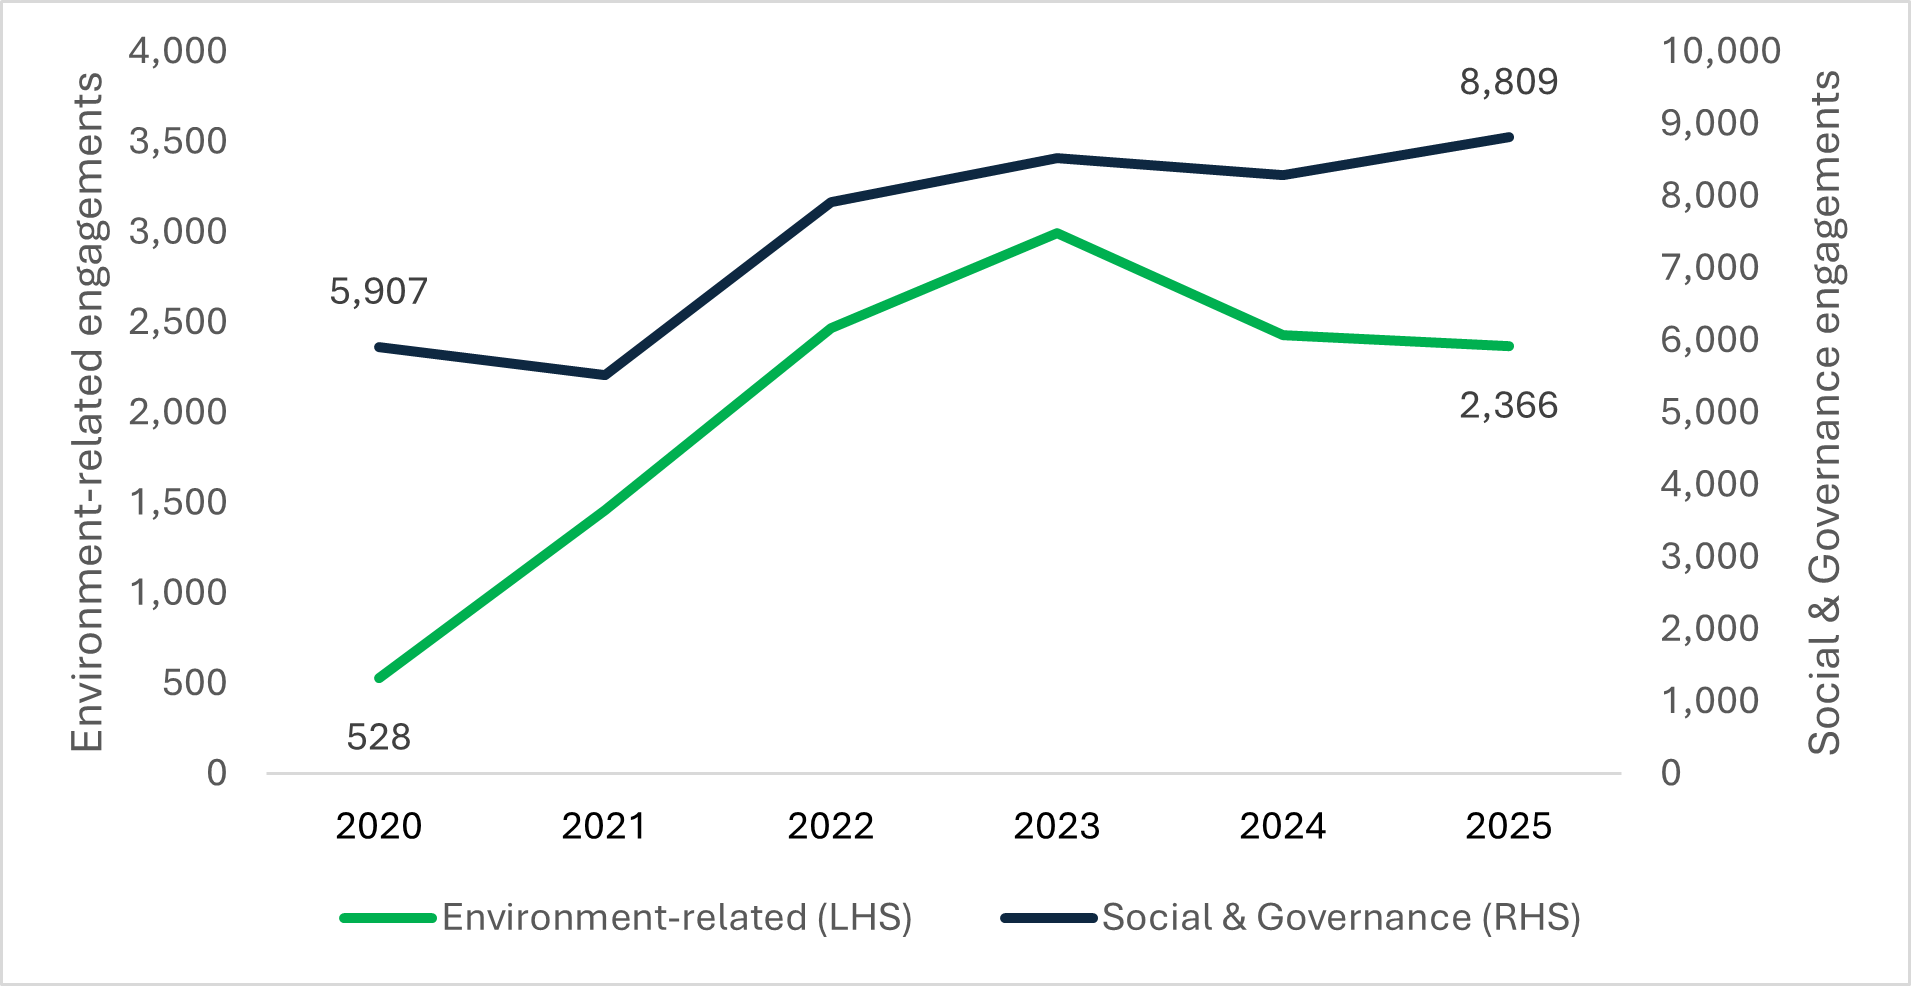
- The total number of environmental-related resolutions voted on by our EFMs increased by 29% from last year, while the total number of engagements saw a slight increase of 4%.
- Since 2020, environmental-related resolutions voted on and environmental-related engagements undertaken by our EFMs have increased by 203% and 348% respectively, as shown in Charts 1 and 2.
Chart 1: Environment-related resolutions voted on by our EFMs increased by 203% since 2020.
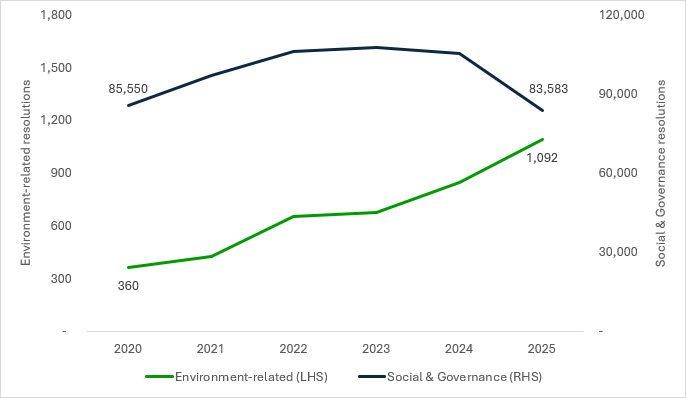
Chart 2: Environment-related engagements with portfolio companies undertaken by our EFMs increased by 348% since 2020.
Voting
Our EFMs’ votes on environmental resolutions serve as an important channel for aligning corporate decisions with sustainable practices.
- APAC and North America made up the majority of the total resolutions voted on by our EFMs at 34% and 31% respectively in 2025, as highlighted in Chart 3.
- On environment-related resolutions in Chart 4, North America generated a significantly higher number of such resolutions compared to Asia Pacific. While there is growing awareness and activism around environmental issues in the Asia Pacific, the practice of putting up environmental resolutions for voting is still developing.
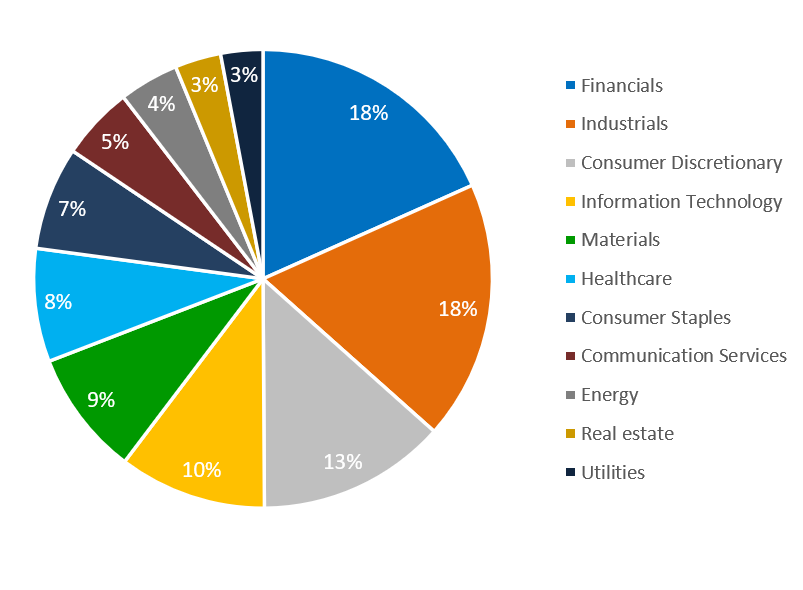
- By sector, the largest proportion of votes in 2025 were in Industrials and Financials at 18% for both respectively, as shown in Chart 5. This reflects the greater materiality of climate change to these sectors, and the maturity of climate strategies adopted by companies in these sectors.
Chart 3: Our EFMs actively voted on resolutions across most geographies in 2025.
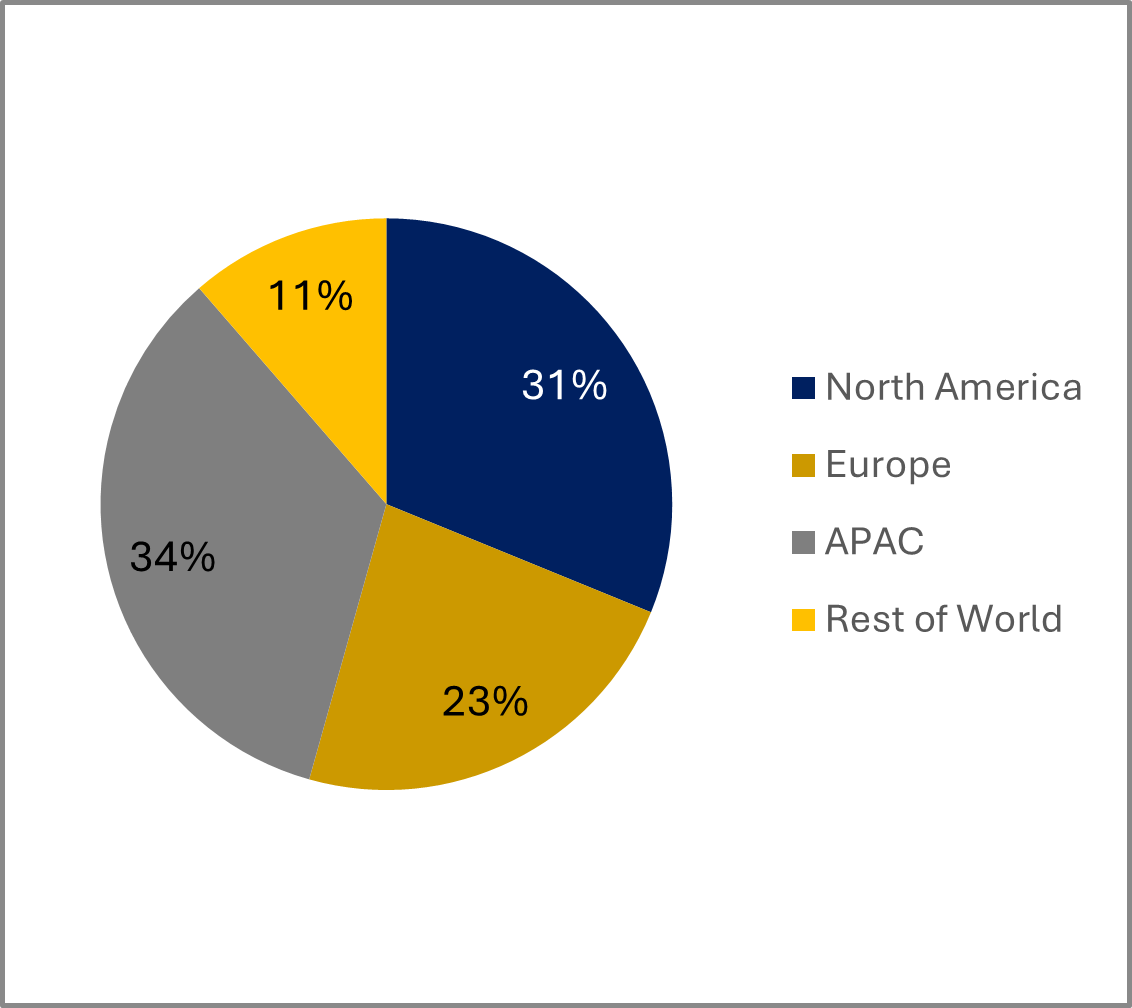
Chart 4: Majority of the environment-related resolutions that our EFMs voted on, were proposed by companies in North America.
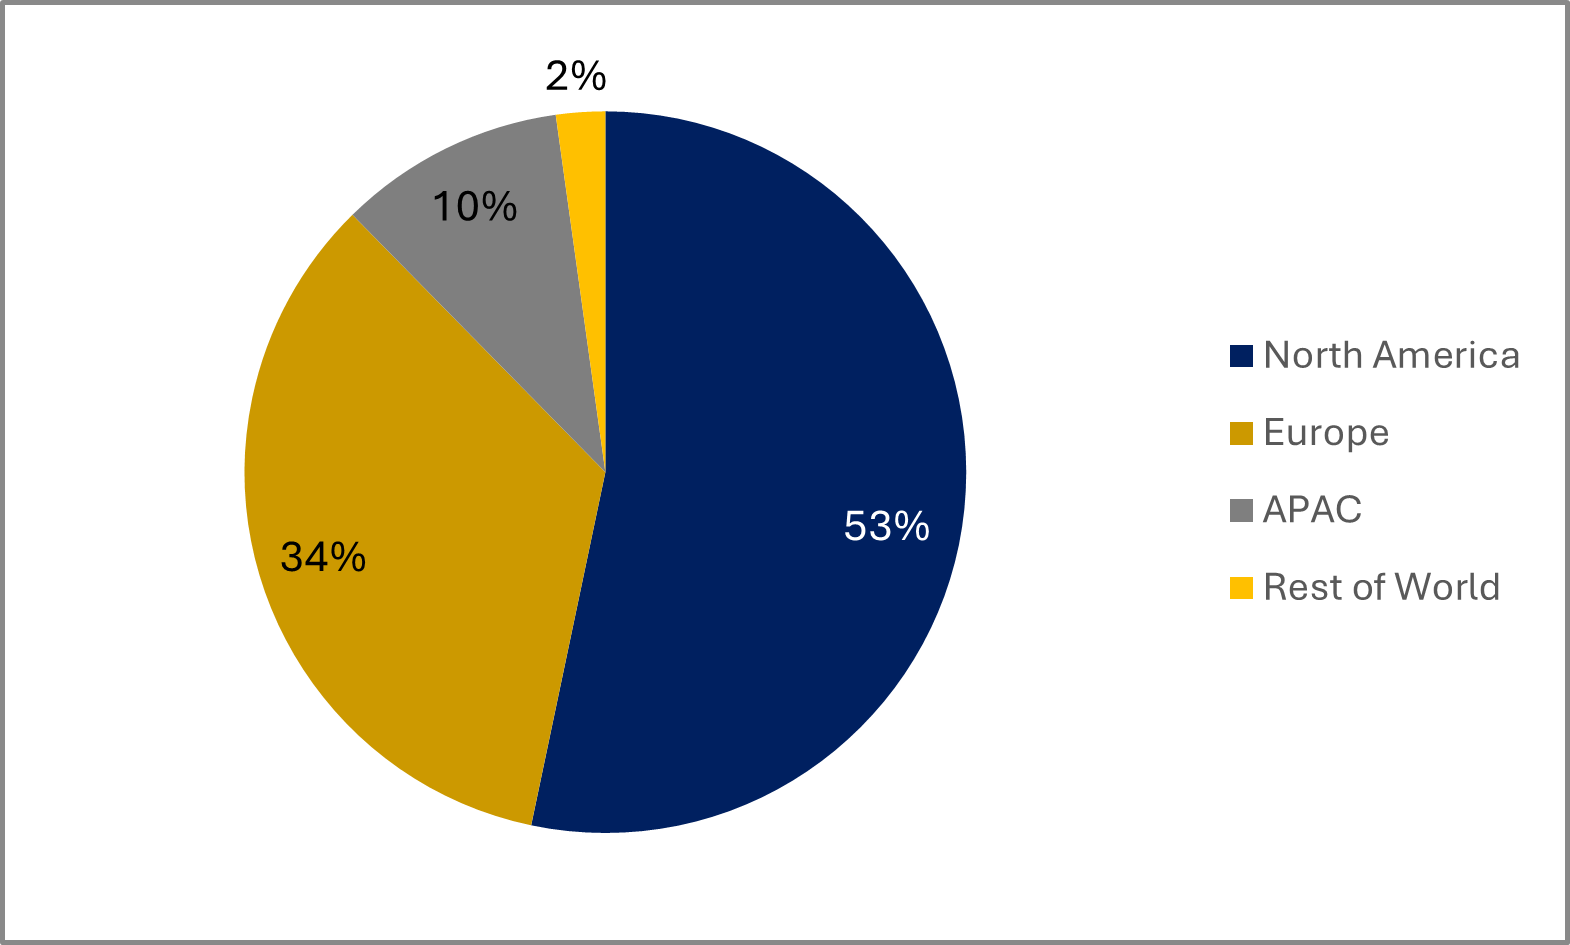
Chart 5: The sectors that our EFMs voted on the most were Financials, Industrials, Consumer Discretionary, and IT.
Engagement
Engaging with companies has proven to be the most effective stewardship tool in driving environmental action.
- In 2025, 96% of our EFMs engaged with their portfolio companies directly. This reflects strong commitment from our EFMs to engage companies meaningfully on material ESG issues.
- Majority of our EFMs’ engagements continue to be with companies in North America and Europe. Environment-related engagements with companies in North America and Europe were comparable between the two years, at 69% in 2025 and 68% in 2024.
Chart 6: Our EFMs undertook engagements across most geographies in 2025.
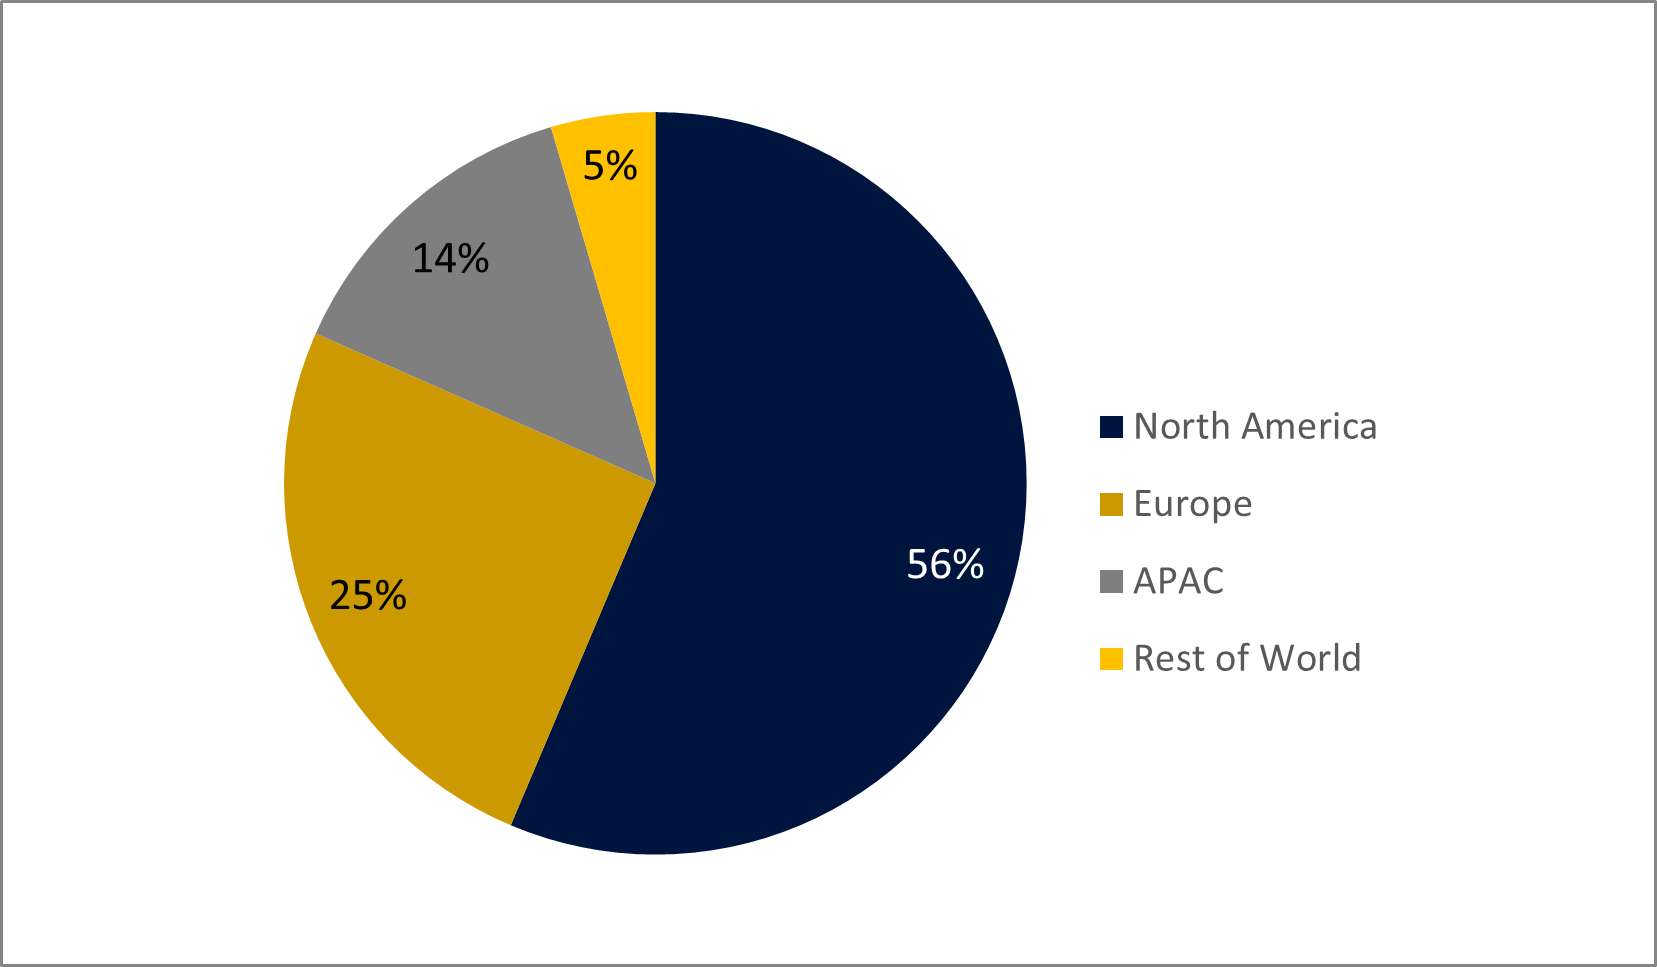
Chart 7: While Europe and North America still account for the majority of our environmental-related engagements at 35% and 34% respectively, portfolio companies in APAC have become more open to such engagements.
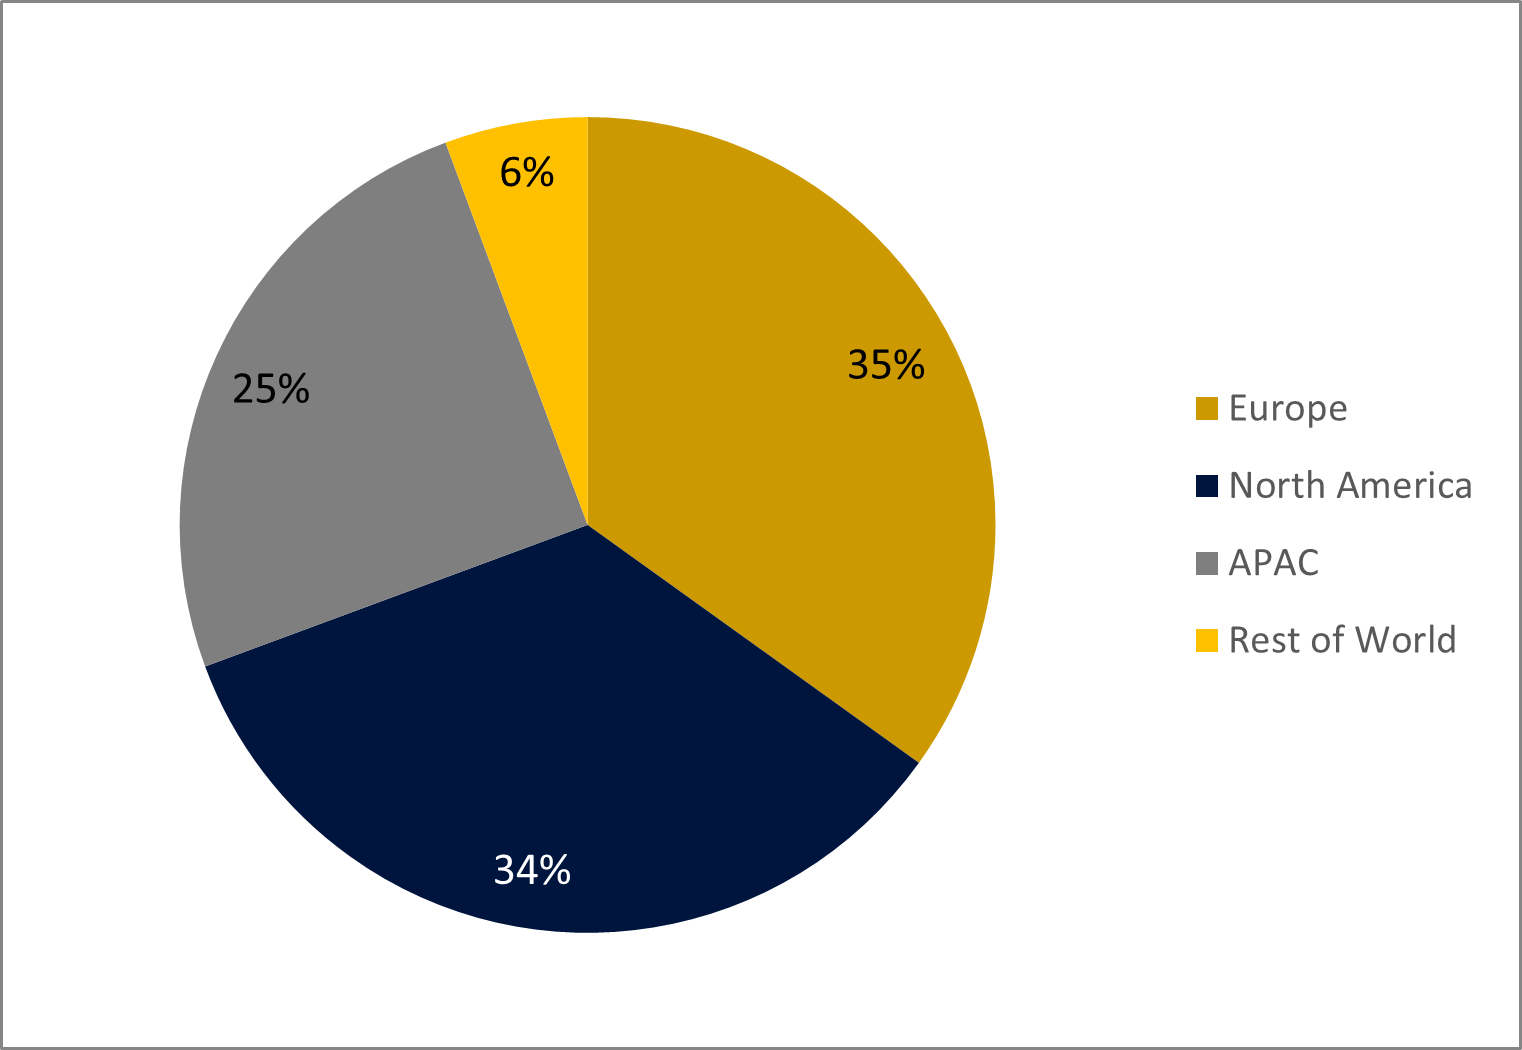
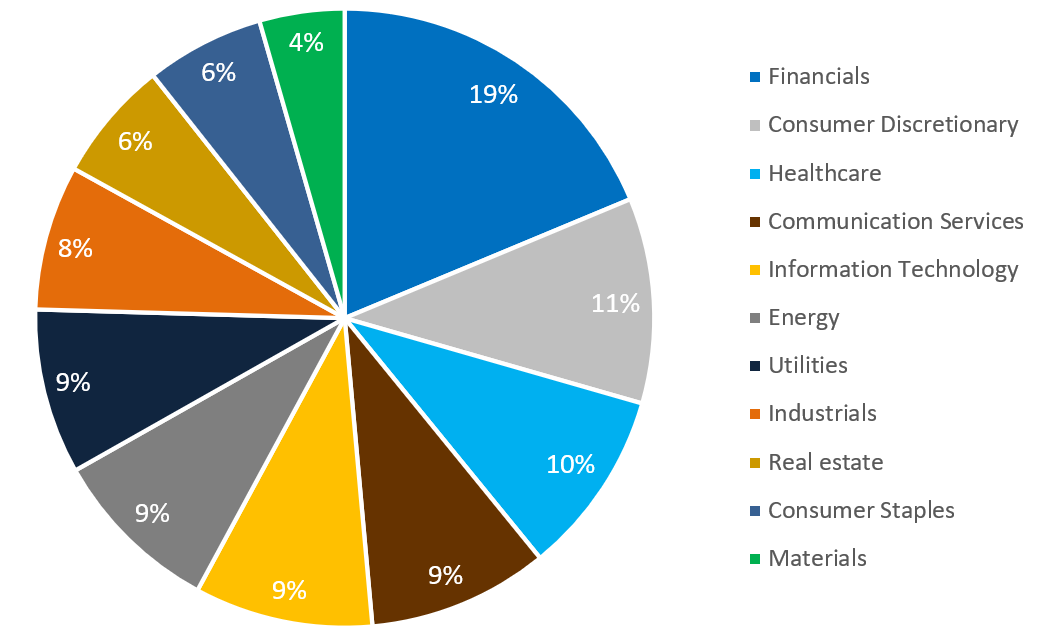
Chart 8: Our EFMs most frequently engage companies in the Financials, Consumer Discretionary, and Healthcare sectors.
Stewardship case studies
Since the 2021/2022 Sustainability Report, we have highlighted examples of how our EFMs have been engaging portfolio companies on how they manage climate risks. These include encouraging them to establish clearer transition plans, make progress towards climate commitments, and improve climate disclosures. The overall voting and engagement statistics provide a sense of the scale and intensity of stewardship activities. The case studies below provide examples of how these efforts made a difference in our portfolio companies.
Case Study 1 - Engagement on Decarbonisation
- One of MAS' EFMs invests in a diversified industrial and digital solutions provider.
- The EFM has consistently engaged with the company to strengthen its overall sustainability strategy and climate-related disclosures.
- Following the engagement, the company achieved multiple climate-related milestones, including improved disclosure on circularity and lifecycle design, strengthened waste and water reduction targets, supplier decarbonisation leadership earning CDP Supplier Engagement Leader status, and Science Based Targets initiative (SBTi) validation including Scope 3 emissions. The company's overall climate progress is strong and trending positively.
Case Study 2 - Engagement on Decarbonisation
- One of MAS' EFMs invests in a global leader in electric vehicle battery solutions and energy storage systems.
- The EFM has consistently engaged with the company on climate change issues to set targets for carbon neutrality in core operations and disclose progress towards these targets, while also reviewing the company's responsible supply chain due diligence and nickel sourcing practices.
- After these engagements, the company affirmed its targets for carbon neutrality across the battery value chain by 2035, with plans to expand emissions disclosures. The company has also committed to enhanced third-party due diligence, including ESG indicators, site visits, interviews, and community checks, improved controls over nickel sourcing by shifting more to its directly owned mine, and development of battery recycling and lower-cost recovery technology. The company has assessed labour and environmental risks and confirmed it has not identified any high-risk suppliers.
Case Study 3 - Engagement on Decarbonisation
- One of MAS' EFMs invests in a multinational leader in climate control solutions for buildings, transport, and industrial applications that develops high-efficiency heating, ventilation and air conditioning systems and next-generation refrigerants with lower global warming potential.
- The EFM engaged with the company to encourage improved sustainability reporting, specifically on how its capital allocation decisions and product development align with its existing Science Based Targets initiative (SBTi)-validated decarbonisation targets for 2030 and net-zero emissions by 2050.
- The EFM believes that clearer disclosures of these linkages will help investors assess how sustainability considerations are embedded into business resilience and growth planning, particularly as demand for climate solutions expands globally.
Scope 1 and 2 WACI of the Equities and Corporate Bonds Portfolios
Measuring the Emissions Profile of MAS' Equities and Corporate Bonds Portfolio
To gauge the level of transition risks and monitor the effectiveness of our actions, we measure and report on the Weighted Average Carbon Intensity (“WACI”) of our equities and corporate bonds portfolios.
The WACI figures presented in this report reflect the Scope 1 and Scope 2 emissions of companies in the portfolio, weighted by the size of MAS’ investment in the company in relation to the size of our equities or corporate bonds portfolios.
- Scope 1 and 2 emissions represent the direct emissions of greenhouse gases controlled and produced by the company and the indirect emissions of greenhouse gases from the consumption of purchased electricity, heat or steam by the company respectively.
- We do not include Scope 3 emissions, which refer to all other indirect emissions occurring in the value chain of the company because (i) the level of Scope 3 emissions reporting by companies remains low today, therefore requiring a large degree of estimation; and (ii) the inclusion of Scope 3 emissions would result in double counting when emissions statistics are aggregated across a large portfolio.
We are developing capabilities to measure and analyse portfolio climate risks using other relevant emissions-based and forward-looking metrics and will consider including these metrics in future reports.
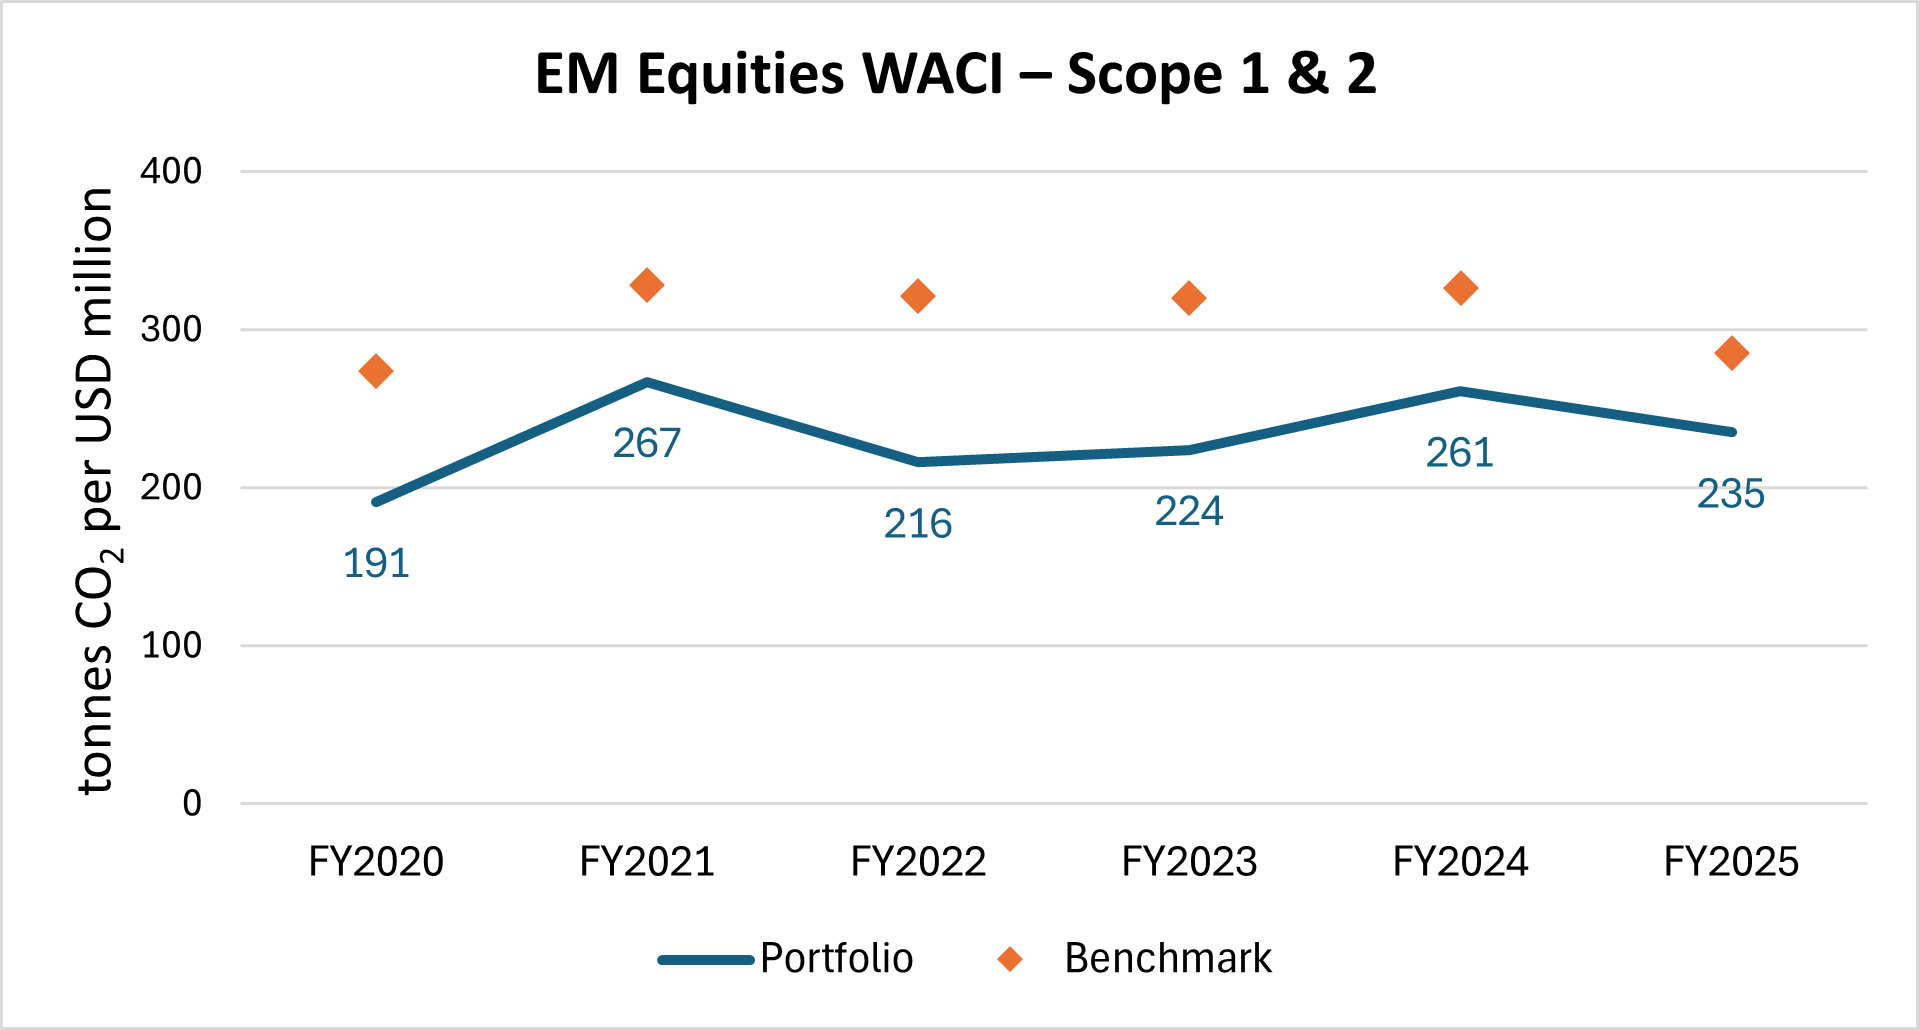
In SR2021/2022, MAS set out an expectation that the WACI for the overall equities portfolio could be reduced by up to 50% by FY2030, relative to the base year of FY2018. The steady progress in WACI reduction across both our Developed Markets (DM) equities portfolio (52% reduction) and Emerging Markets (EM) equities portfolio (12% reduction) reflects that we are making good headway towards meeting this expectation.
The broad reduction in the equities portfolio WACI reflects a structural shift away from carbon-intensive Energy, Materials and Utilities (“EMU”) sectors towards less carbon-intensive growth sectors such as Information Technology (IT) and Communication Services. EMU sectors, which include thermal power generation, chemical manufacturing, and fuel extraction, historically drove portfolio WACI – contributing approximately 77% of benchmark WACI for DM and 78% for EM in FY2018. Reducing EMU sectors weights has accordingly lowered overall WACI. To elaborate:
- In the DM benchmark, EMU sector weights fell from about 13% in FY2018 to 11% in FY2025, while IT and Communication Services increased from 22% to 34%, driving the downward WACI trajectory.
- Similarly in the EM benchmark, EMU sector weights decreased from about 17% in FY2018 to 14% in FY2025, while IT and Communication Services rose from 30% to 40%.
These WACI reductions reflect benchmark changes, and MAS’ targeted portfolio actions, including the Climate Transition Programme (“CTP”) and the exclusion of thermal coal mining and oil sands companies, have further tilted the portfolio towards less carbon-intensive companies. That said, year-to-year WACI movements may not follow a smooth path given idiosyncratic events and portfolio decisions by external fund managers in different market cycles. The moderating pace of decarbonisation across both DM and EM equities, reflecting broader market trends, also bears monitoring.
On a year-on-year basis, MAS' DM equities portfolio WACI increased from FY2024 to FY2025, in line with the DM equities benchmark (see Chart 9). This was primarily driven by higher exposure to carbon-intensive EMU sectors, whose valuations rose alongside higher global commodity prices. Nonetheless, MAS' DM equities portfolio WACI remained below the benchmark, arising from active allocation decisions of external managers, and targeted portfolio actions such as the CTP and the exclusion of thermal coal mining and oil sands companies, which collectively tilted the portfolio towards less carbon-intensive companies.
Chart 9: DM Equities Portfolio WACI (in tonnes CO2e/ USD million of revenues)
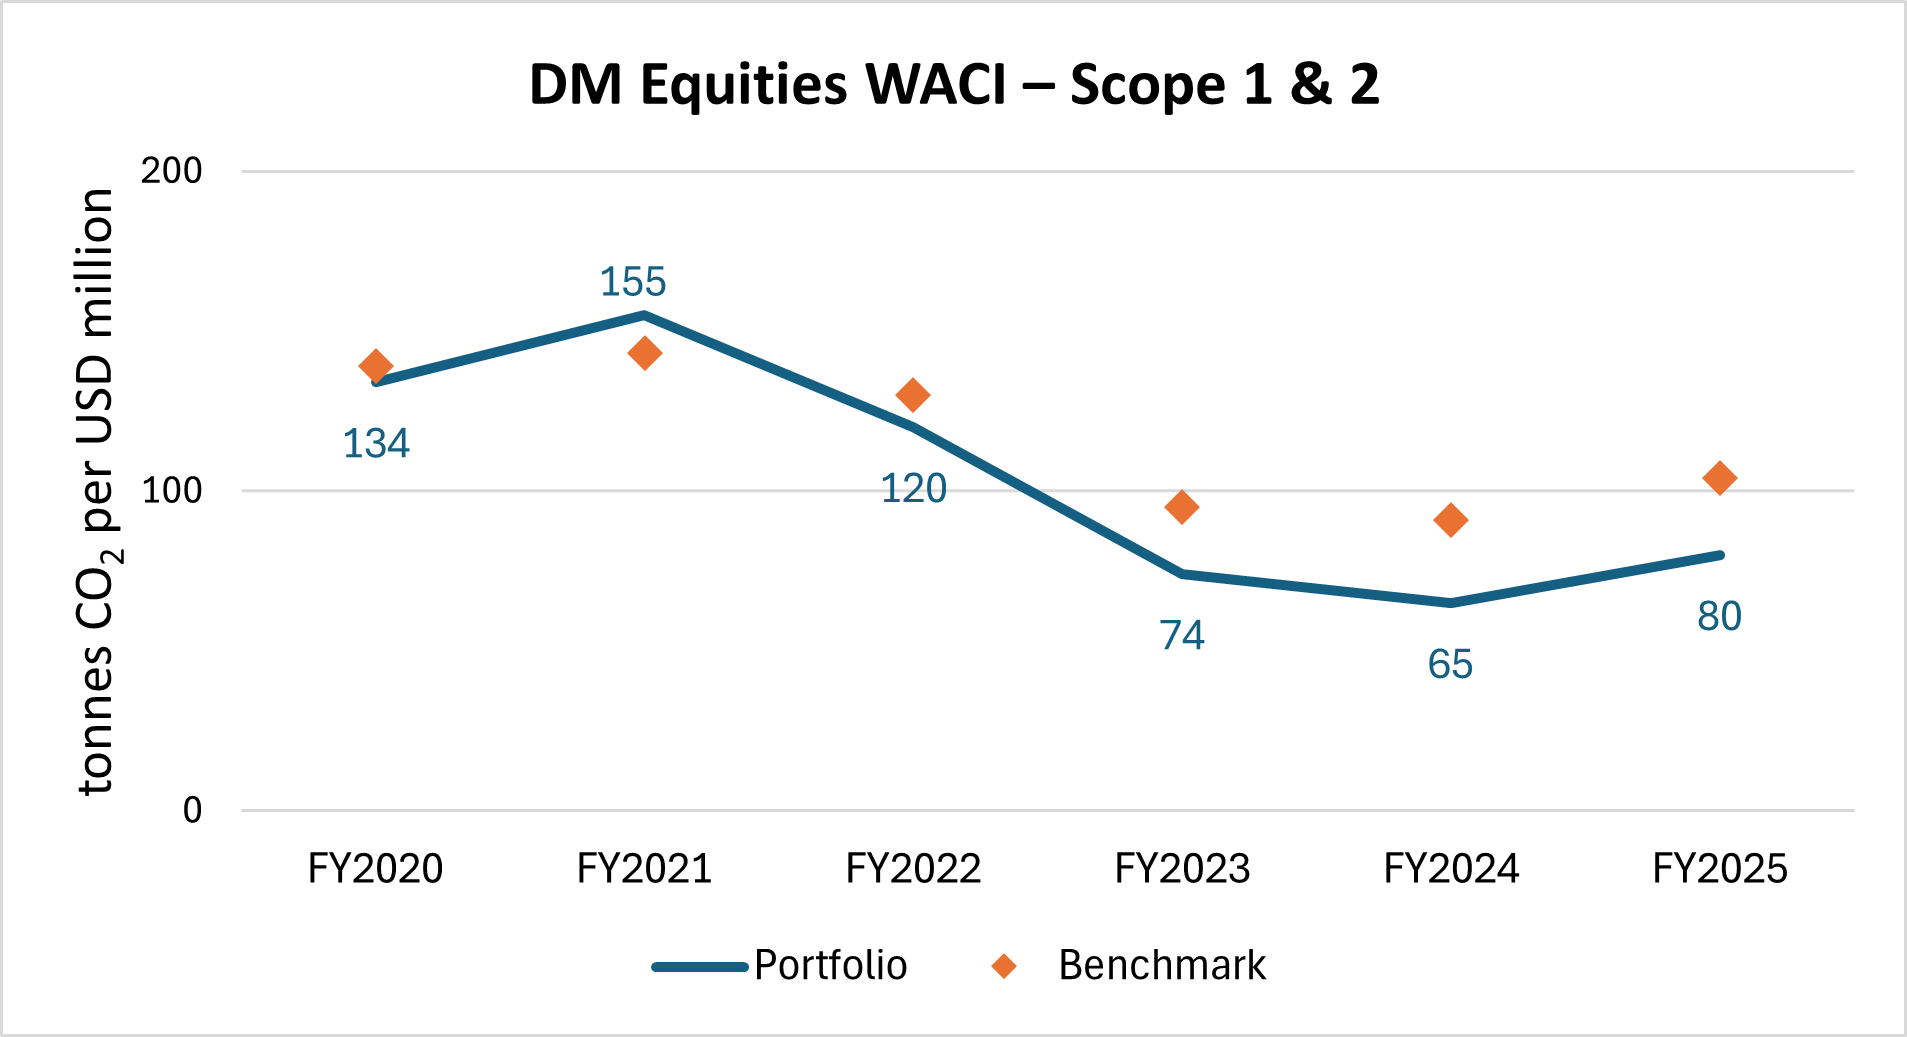
Chart 10: EM Equities Portfolio WACI (in tonnes CO2e/ USD million of revenues)
Corporate Bonds are relatively less exposed to transition risk than equities, as they have fixed tenures and bond investors are ranked higher in the capital structure than equity investors. Notwithstanding, as part of MAS’ efforts to manage long-term risks, we expanded the scope of our emissions monitoring and reporting to include the corporate bonds portfolio from FY2021.
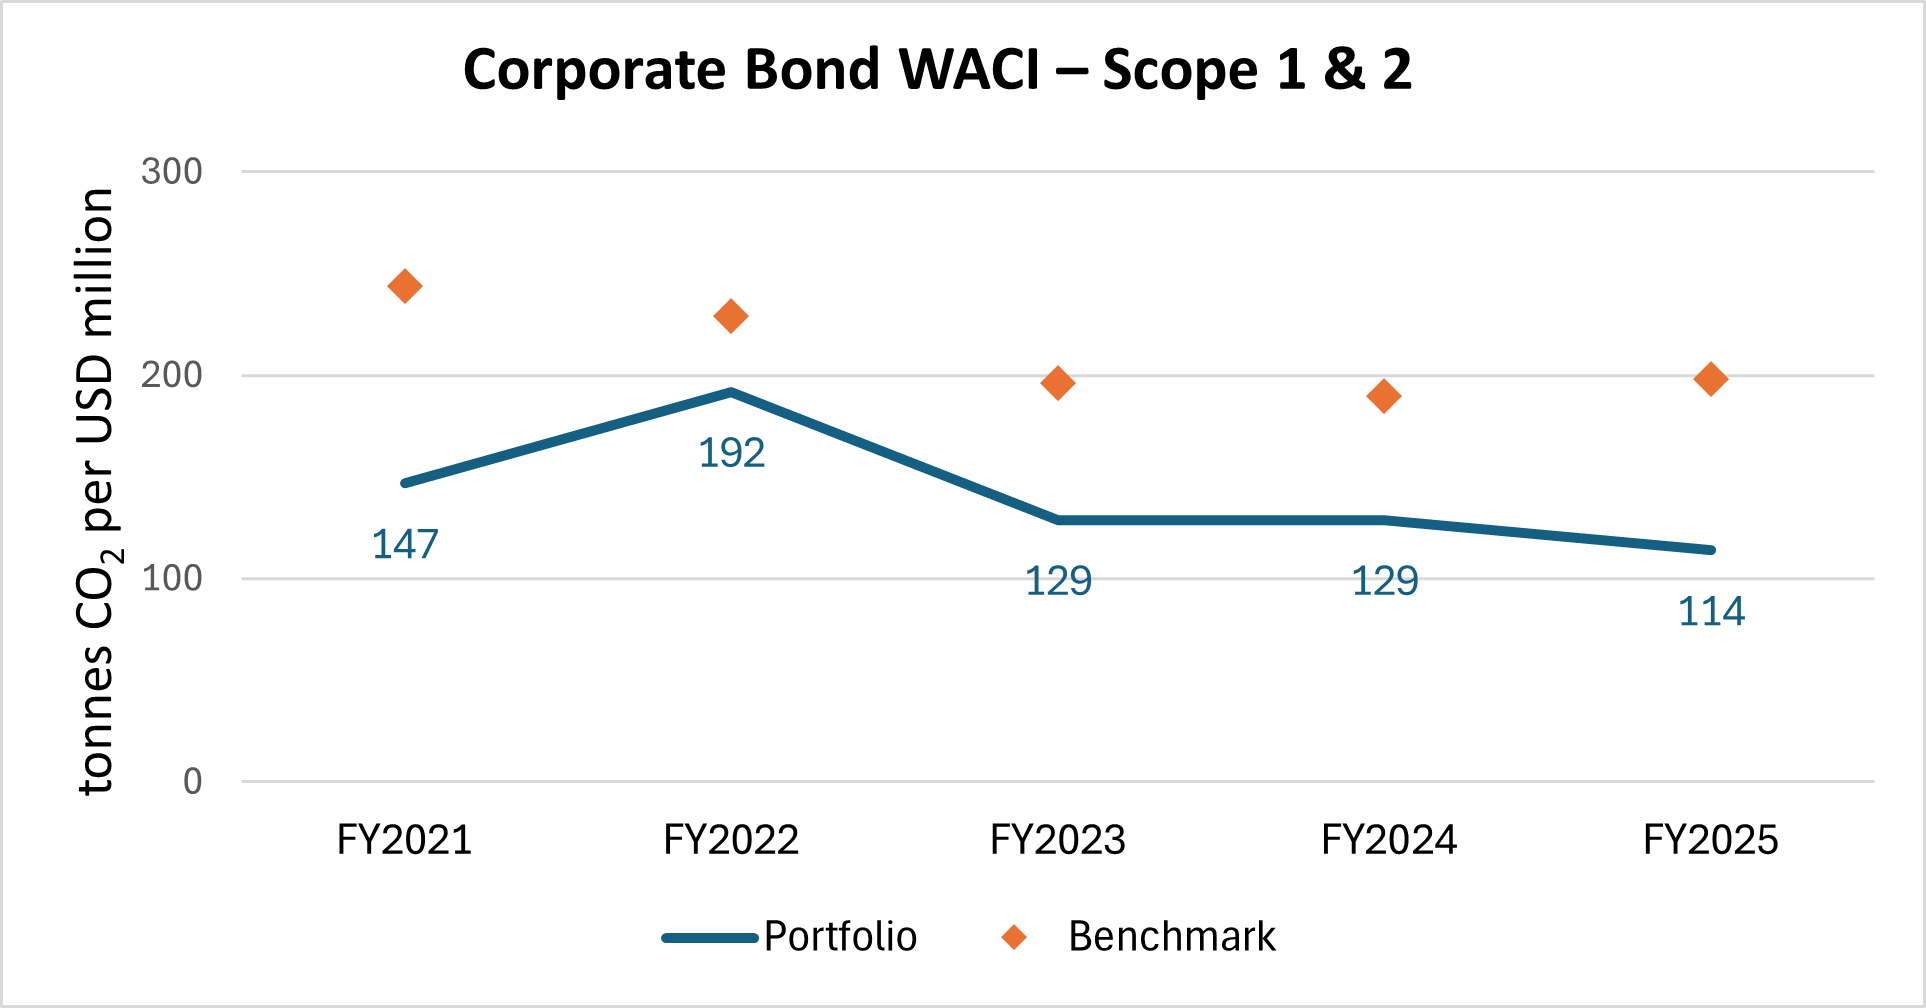
MAS’ Corporate Bond portfolio WACI decreased from FY2024 to FY2025, despite a slight increase in the benchmark WACI. This was primarily due to the implementation of CTP for the Corporate Bonds portfolio in FY2025, which tilted the portfolio towards less-carbon intensive companies relative to the benchmark.
MAS’ portfolio construction framework, which screens out debt securities with smaller issuance sizes that tend to be in more carbon intensive sectors, also contributed to the lower WACI. As of FY2025, MAS’ Corporate Bonds portfolio WACI remained below the benchmark.
MAS will continue to monitor portfolio WACI trends across both our equities and corporate bond portfolios, calibrate portfolio actions, and assess risks and opportunities associated with the shifts in the eventual transition pathway.
Chart 11: Corporate Bonds Portfolio WACI(in tonnes CO2e/USD million of revenues)
* Certain information contained herein (the “Information”) is sourced from/copyright of MSCI Inc., MSCI ESG Research LLC, or their affiliates (“MSCI”), or information providers (together the “MSCI Parties”) and may have been used to calculate scores, signals, or other indicators. The Information is for internal use only and may not be reproduced or disseminated in whole or part without prior written permission. The Information may not be used for, nor does it constitute, an offer to buy or sell, or a promotion or recommendation of, any security, financial instrument or product, trading strategy, or index, nor should it be taken as an indication or guarantee of any future performance. Some funds may be based on or linked to MSCI indexes, and MSCI may be compensated based on the fund’s assets under management or other measures. MSCI has established an information barrier between index research and certain Information. None of the Information in and of itself can be used to determine which securities to buy or sell or when to buy or sell them. The Information is provided “as is” and the user assumes the entire risk of any use it may make or permit to be made of the Information. No MSCI Party warrants or guarantees the originality, accuracy and/or completeness of the Information and each expressly disclaims all express or implied warranties. No MSCI Party shall have any liability for any errors or omissions in connection with any Information herein, or any liability for any direct, indirect, special, punitive, consequential or any other damages (including lost profits) even if notified of the possibility of such damages.