Metrics and Targets
Measuring portfolio emissions
Measuring the carbon intensity of MAS’ equities and corporate bonds portfolio
In measuring the carbon intensity of our equities and corporate bonds portfolio, we only considered Scope 1 and Scope 2 emissions, which are the direct emissions of greenhouse gas controlled and produced by the company and the indirect emissions of greenhouse gas from the consumption of purchased electricity, heat or steam by the company respectively. We excluded Scope 3 emissions, which refer to all other indirect emissions occurring in the value chain of the company as (i) the level of reporting of Scope 3 emissions by companies remains low today, therefore requiring a larger degree of estimation; and (ii) the inclusion of Scope 3 emissions would result in double counting when emissions statistics are aggregated at the portfolio level.
Weighted Average Carbon Intensity (WACI)
The carbon profile of the equities and corporate bonds portfolios are reported using WACI, which measures carbon intensity (i.e. the CO2 equivalent emissions per unit of revenues) for each of the companies in the portfolio, weighted by the relative size of the investments in the respective portfolios. Therefore, WACI measures the equities portfolio’s exposure based on the carbon efficiency of the underlying companies, making it a useful indicator to assess transition risks relative to benchmarks and across portfolios managed by external fund managers (EFMs). WACI is also the preferred metric recommended for asset owners by the Task Force on Climate-related Financial Disclosures (TCFD).
Weighted average carbon intensity of equities portfolio
Measuring equities portfolio WACI against market benchmarks
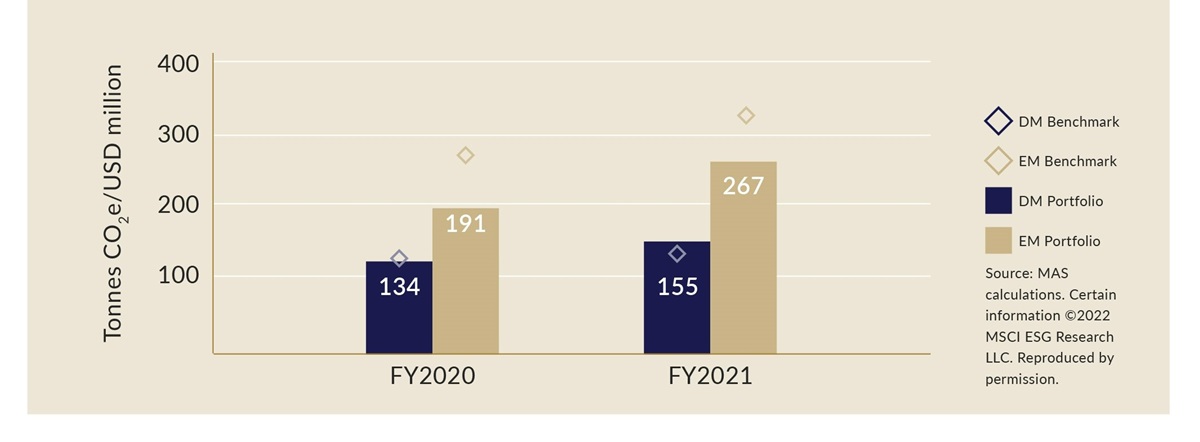
The WACI for both Developed Markets (DM) and Emerging Markets (EM) equities portfolios increased from end-March 2021 to end-March 2022, alongside an increase in the WACI of their respective benchmarks. WACI contribution continues to be concentrated in the carbon intensive Energy, Materials and Utilities sectors. These top three sectors alone contribute more than 70% of the WACI for broad equity market benchmarks like MSCI All Country World Index (ACWI). Between end-March 2021 and end-March 2022, the increase in WACI for both the equities portfolio and the benchmark was driven by an increase in exposure to these sectors.
The increase in both benchmark and portfolio WACI was due to a cyclical rotation in market capitalisation towards energy, materials and utilities companies, which typically perform well in an inflationary, strong growth environment but are also the more pollutive sectors:
- First, the market capitalisation of such companies rose as energy and commodities prices soared due to demand and supply dynamics, weather-related factors, and geopolitical tensions. This increased their weights in the benchmarks and by extension our portfolio.
- Second, as the equities portfolio is actively managed by our external managers, the economic recovery arising from the loosening of COVID-related restrictions saw a sector rotation into economically sensitive and cyclical sectors. While the equities portfolio continues to be underweight in the Energy, Materials and Utilities sectors, the extent of the underweight has narrowed.
As at end-March 2022, the WACI for MAS’ EM equities portfolio of 267 tCO2e/US$ million remained lower than its benchmark by 19%. As the WACI for the DM equities portfolio was only marginally lower (3%) than the benchmark as at end-March 2021, the effects of the cyclical market movement and active allocation caused WACI to move 8% higher than its benchmark as at end-March 2022.
Notwithstanding the increase in WACI over the period, we expect the WACI of the equities portfolio to decline over time, supported by the implementation of the portfolio actions highlighted above.
Chart 1: Equities Portfolio WACI
(in tonnes CO2e/USD million of revenues)
Emissions reduction for equities portfolio
Reducing WACI of the equities portfolio
The latest Intergovernmental Panel on Climate Change (IPCC) report warned that the accumulated 1.1 degrees Celsius of warming to date has led to an increase in extreme and disruptive weather events, which heightens the risk of accelerated and aggressive transition policies, e.g. higher carbon prices.
MAS expects to reduce WACI of the equities portfolio by up to 50% by FY2030
- MAS aims to build a climate-resilient portfolio to mitigate risks arising from low carbon transition scenarios and to capture upside opportunities from climate change.
- Commited climate policy actions to-date are not consistent with an emissions trajectory that will limit expected temperature increase to 1.5°C (the temperature goal set out in the Paris Agreement).
- MAS will therefore take portfolio actions to position the investment portfolio for such a scenario.
- However, we are of the view that the pace of decarbonisation could pick up in the coming years as government policies, business models, and consumption demand patterns worldwide change in response to growing awareness of the urgency to take stronger mitigating actions.
- We estimate that the portfolio actions that we implement over time will contribute to reducing the WACI of our equities portfolio by up to 50% by FY2030 compared to the base year of FY2018 (ending March 2019).
- Our climate portfolio actions, with their associated medium-term WACI reduction estimate, should put us in a position to align with a transition to net-zero by 2050, if the real economy undergoes substantial decarbonisation and generates more net-zero investment opportunities.
- In view of the uncertainties surrounding possible transition pathways and potential impacts, MAS will continuously and vigilantly monitor new data and signposts to validate the baseline expectation for the world’s climate actions and decarbonisation progress, and to adjust our climate portfolio actions as the low carbon transition risk evolves.
Weighted average carbon intensity of corporate bonds portfolio
Measuring MAS’ corporate bond portfolio against market benchmarks
Corporate bonds are relatively less impacted by transition risks than equities, since bonds generally have fixed tenures and corporate bonds investors as creditors are higher up the capital structure relative to equity shareholders. Notwithstanding, as part of MAS' efforts to manage its long-term risks, we have expanded the scope of our monitoring and reporting of portfolio emissions to include our corporate bonds portfolio.
As the corporate bonds portfolio comprises mainly DM issuers, we report a single WACI figure (instead of segmenting into DM and EM corporate bonds) against the WACI of a broad investment grade corporate bond benchmark.
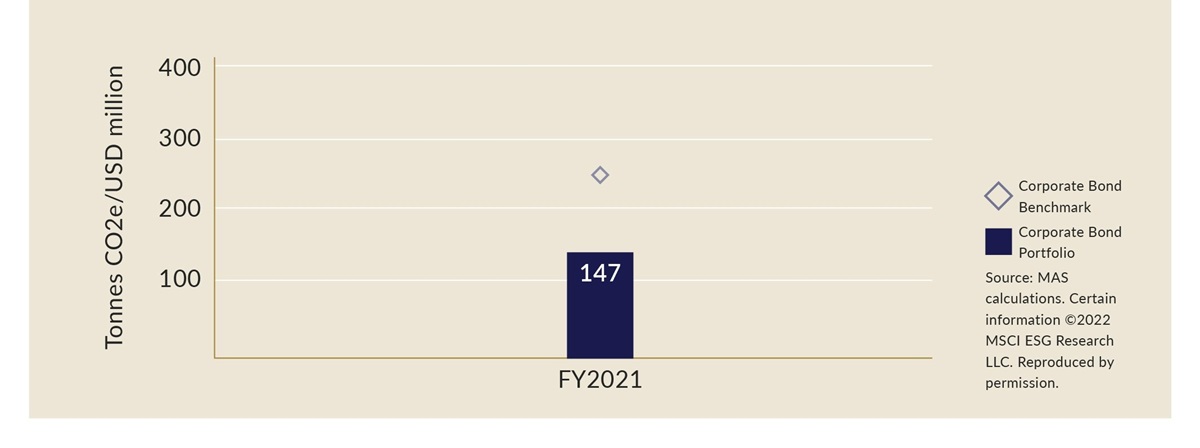
The WACI for the corporate bond portfolio as at end-March 2022 was 40% lower compared to the benchmark*.
The lower WACI was attributable to MAS’ portfolio construction framework that screens out debt securities with smaller issuance sizes. This has resulted in a lower portfolio exposure to securities issued by companies in carbon intensive sectors compared to market benchmark.
* Last updated on 21 February 2023
Chart 2: Corporate Bonds Portfolio WACI
(in tonnes CO2e/ USD million of revenues)
Monitoring development of forward-looking metrics
We are monitoring the development of forward-looking metrics to complement WACI to assess and manage transition risks of the portfolio
WACI is the main carbon metric that we currently track and report for the equities and corporate bonds portfolios. However, WACI is inherently backward-looking in nature. It measures the current levels of carbon emissions of companies but does not consider the future emissions trajectory based on their climate commitments and transition plans. As a result, a portfolio with higher WACI today does not necessarily imply that it is less aligned with an orderly transition scenario, and vice versa.
To complement WACI, we are monitoring the development of forward-looking metrics such as portfolio alignment metrics. Such metrics, e.g. implied temperature rise, are useful only if underpinned by comprehensive, comparable and consistent data on companies’ future emissions trajectory. At this point, the reliability of such metrics is not high. Data and disclosure gaps make it challenging to compare future emissions trajectory against sectoral or regional decarbonisation pathways, and thereby assess the extent of the alignment of the portfolio against future climate scenarios or temperature outcomes.
We assessed the coverage of companies in the equities portfolio that have set emissions reduction targets
Companies’ verifiable emissions reduction targets can serve as a proxy to assess companies’ future emissions trajectories. Such targets can be viewed as objective and quantifiable measures of a company’s climate-related commitment and decarbonisation plans.
Chart 3: Percentage of Equities Portfolio (by Market Value) Covered by Companies with Emissions Reduction Targets
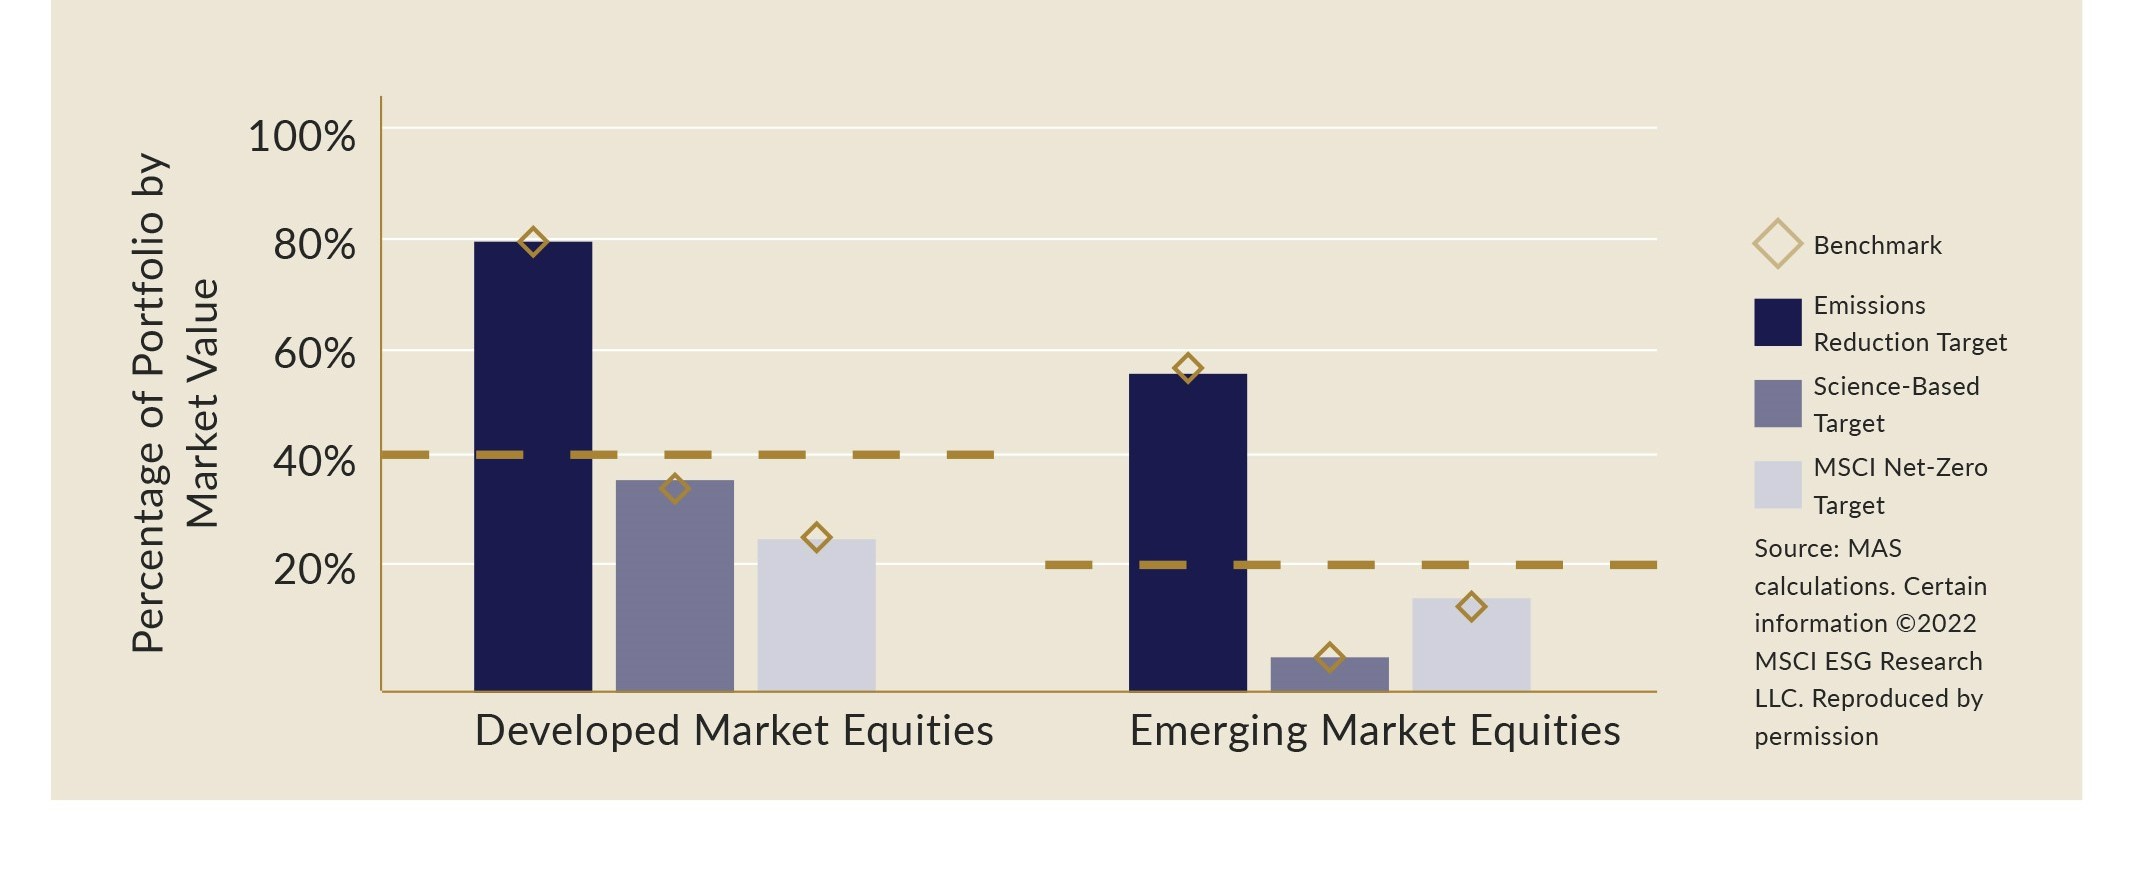
While 80% of the companies in the DM equities portfolio has announced some form of emissions reduction targets, less than 40% of companies in the DM equities and 20% of companies in the EM equities portfolios have disclosed sufficient information for the emission reduction targets of these companies to be comprehensively assessed to be aligned with transition pathways that are associated with global climate goals. In particular, some companies could have set seemingly ambitious targets but cover only specific product lines and activities. An analysis of our equities portfolio coverage of target-setting companies is shown in Chart 3 using data aggregated by MSCI ESG Research LLC.
We will continue to monitor the development of portfolio alignment tools and other forward-looking metrics and evolve our approach for assessing climate risk accordingly.